• Overview
  • Reviews (2)
  • Comments (3)
  • What's new

DeltaBook

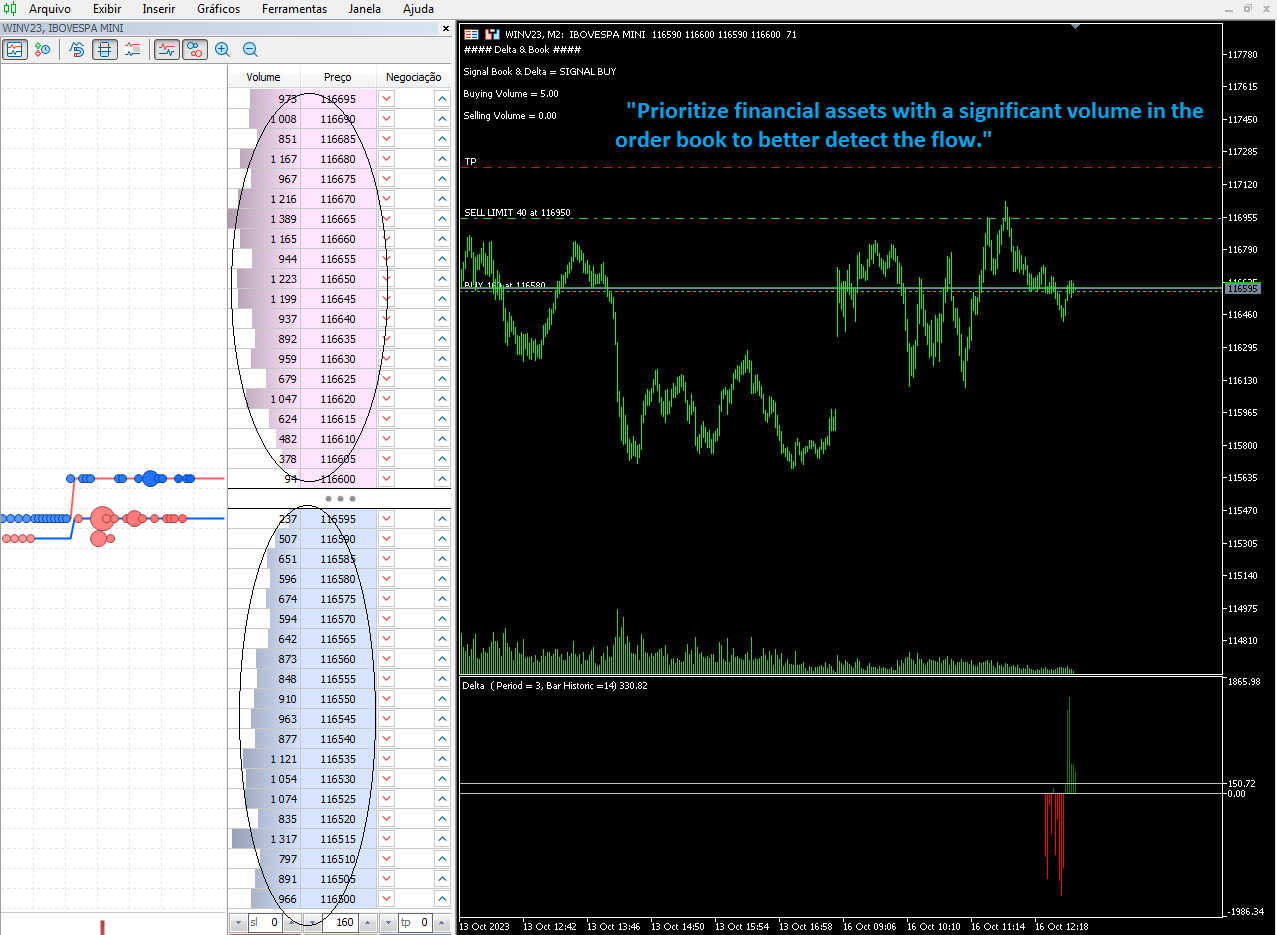
The Delta Book indicator is a powerful market analysis tool that combines the use of volume delta with information from the order book to detect price flow in financial markets such as stocks, futures, and cryptocurrencies. It is important to note that the Delta Book requires access to real-time volume data and order book information to realize its full potential.

The main feature of the Delta Book is its advanced market analysis strategy, which allows traders and investors to identify trends and trading opportunities based on detailed information about market participants' behavior. Here are some tips and important aspects to describe the Delta Book indicator:

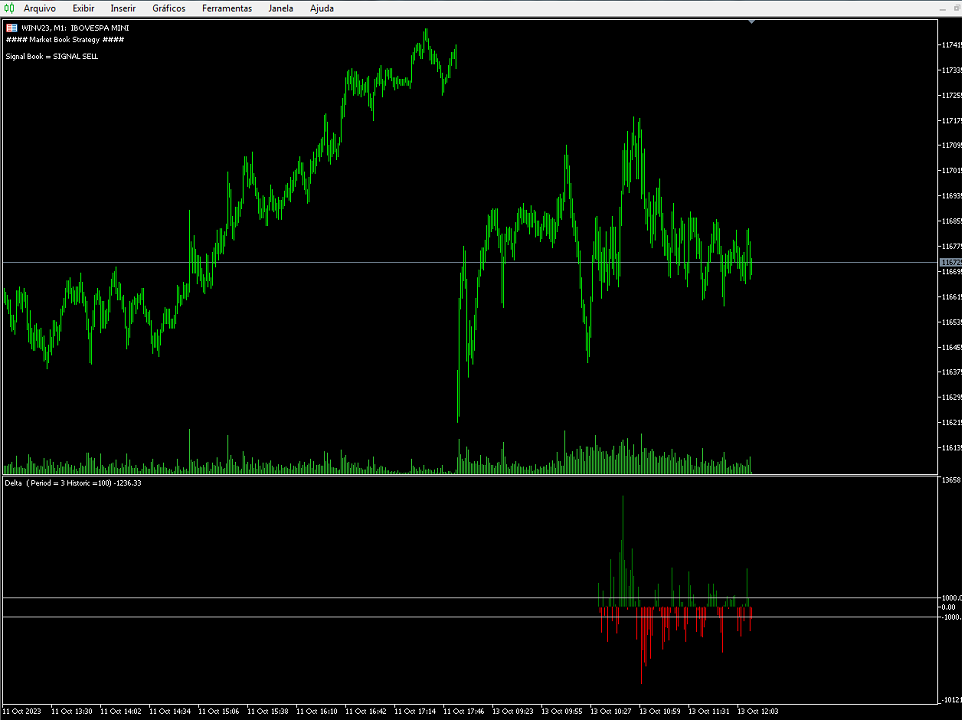
  • Volume Delta: Volume delta is the difference between the volume bought (demand) and the volume sold (supply) in a given time period. This indicator quantifies the imbalance between buyers and sellers, helping to identify changes in buying and selling pressures in the market.

  • Order Book: The order book is a real-time record of all buy and sell orders in a market. It displays the prices at which traders are willing to buy and sell an asset, as well as the quantity of assets they want to trade at these prices. The Delta Book uses information from the order book to analyze market participants' behavior.

  • Price Flow: The Delta Book helps identify price flow, i.e., how the price of an asset is affected by changes in volume delta and the order book. This is crucial for understanding how buy and sell orders affect price movements.

  • Trends and Reversals: Based on volume delta and order book information, the Delta Book can help identify uptrends, downtrends, and potential trend reversals. Traders can use this information to make informed decisions about their market positions.

  • Real-Time Data Requirements: To make the most of the Delta Book indicator, users need access to real-time data, including volume information and the order book. This may require using advanced trading platforms and obtaining real-time data feeds.

  • Customization and Trading Strategies: The Delta Book offers flexibility for traders to customize their strategies based on the provided information. It can be used in conjunction with other technical analysis tools to develop sophisticated trading strategies.

In summary, the Delta Book indicator is an advanced market analysis tool that uses volume delta and order book information to detect price flow and assist traders in making informed decisions. It is best suited for markets like stocks and futures where the order book is an integral part of trading.


Recommended products
Weis Waves
Flavio Javier Jarabeck
3.15 (26)
The original author is David Weis, an expert in the Wyckoff Method. The Weis Wave is a modern adaptation of the 1930's Wyckoff Method, another expert in Tape Reading techniques and Chart Analysis. Weis Waves takes market volume and stacks it into waves according to price conditions giving the trader valuable insights about the market conditions. If you want to learn more about this subject you can find tons of videos in YouTube. Just look for "The Wickoff Method", "Weis Wave" and "Volume Spread
FREE
WAPV Weis Wave Chart Forex
Eduardo Da Costa Custodio Santos
The Weis Wave Chart Forex for MT5 is a Price and Volume indicator. The Price and Volume reading was widely disseminated through Richard Demille Wyckoff based on the three laws created by him: Supply and Demand, Cause and Effect and Effort vs. Result. In 1900 R.Wyckoff already used the wave chart in his analyses. Many years later, around 1990, David Weis Automated R. Wyckoff's wave chart and today we bring you the evolution of David Weis' wave chart. It shows the amount of Volume and the amount o
Visual Bollinger Bands Divergence
Luiz Felipe De Oliveira Caldas
VWAP Bands Visual Style 1.0 Financial market indicators are essential tools used by traders and investors to analyze and make decisions in the financial markets. VWAP and Bollinger Bands are two popular technical analysis tools used by traders to measure market trends and price volatility. In this product, we propose combining the two indicators to create a unique product that provides a comprehensive analysis of market trends and volatility. This product will be ideal for traders and investors
Weiss Wave with lots of functionality and lightweight. The same can be used both in markets that have access to volume (REAL=Contracts, Tick=Business) or points! You will be able to:     - Analyze the volume of the market by swings made!     - Define the source of the data presented in the graphic, its size and color! Or simply hide this information!     - Define whether or not to show the swings in the graph and how many swings! In addition to setting the trend line color, thi
Value Chart Candlesticks
Flavio Javier Jarabeck
4.7 (10)
The idea of a Value Chart indicator was presented in the very good book I read back in 2020 , " Dynamic Trading Indicators: Winning with Value Charts and Price Action Profile ", from the authors Mark Helweg and David Stendahl. The idea is simple and the result is pure genius: Present candlestick Price analysis in a detrended way! HOW TO READ THIS INDICATOR Look for Overbought and Oversold levels. Of course, you will need to test the settings a lot to find the "correct" one for your approach.
FREE
White Weis Volume Ticks
Ricardo Almeida Branco
5 (3)
White Weis Volume This indicator shows the sum of the volume in each wave, bulish or bearish, as idealized by David Weis , but it brings an important addition , which is the marking of the bar with the highest volume of the wave (White Bar)! In coding the indicator, it was sought to optimize the code to require minimal processing during use and not to overload mt5. The indicator can be used for pre-trading analysis and study, where the trader analyzes possible points of support and resi
Weis Wave Double Side
Eduardo Da Costa Custodio Santos
The Weis Wave Bouble Side Indicator for MT5 is part of the toolkit (Wyckoff Academy Wave Market) The Weis Wave Bouble side Indicator for MT5 was created based on the already established Weis Wave created by David Weis. The Weis Wave Double Side indicator reads the market in waves as it was done by R. Wyckoff in 1900. It helps in the identification of effort x result, cause and effect, and Supply and demand Its differential is that it can be used below the zero axis, further improving plus operat
Description The indicator uses market profile theory to show the most relevant trading zones, on a daily basis. The zones to be shown are LVN (low volume nodes) and POC (point of control). An LVN zone is one which represents price areas with the least time or volume throughout the day. Typically, these areas indicate a supply or demand initiative, and in the future, they can turn into important breakout or retracement zones. A POC zone is one which represents price areas with the most time or vo
FabFlowInPrice
Fabiano Luiz Roberto
Tape Reading, flow monitoring. FabFlowInPrice   is a powerful indicator for those who like Tape Reading (Times & Trades). It presents the volumes traded at each price level, considering the purchase, sale and direct aggressions for each level. Excellent tool for market flow analysis. Thought of flow so monitor who is attacking the most, buyers, sellers or direct exchanges, thought FabFlowInPrice. The indicator displays information in 4 distinct and fixed periods, on any timeframe: @Day - All
Signals Supply and Demand Force
Claudio Angelo Chumpitaz Flores
Este Indicador esta basado en el rebote de un soporte o resistencia fuerte con un indicador que tiene interno de fuerza de movimiento. Tiene la opción de ver el soporte y resistencia actual y ver la fuerza que tiene dicho soporte o resistencia.(Activando el parámetro Ver_Sop_Res ) Parámetros: Sop o Res, Fuerza Mayor a...: Con este parámetro podrás ajustar la fuerza del soporte o resistencia, con la cual el indicador evaluara si es una señal bajista o alcista. Velas Historial: Con este parámetro
VolumeDeltaWaves
Stanislav Korotky
5 (1)
This indicator is an extended implementation of Weis waves. It builds Weis waves on absolute volumes (which is the classical approach) or delta of volumes (unique feature) using different methods of wave formation and visualization. It works with real volumes, if available, or with tick volumes otherwise, but also provides an option to use so called "true volume surrogates", as an artificial substitution for missing real volumes (for example, for Forex symbols), which was introduced in correspo
Discover the power of volume analysis with our volume profile indicator for Metatrader!   /   MT4 Version Basic Volume Profile is an indicator specifically designed for manual traders looking to optimize their trading. The Volume Profile Indicator is an essential tool for any serious trader looking to better understand market behavior. With our innovative solution you can clearly and concisely visualize how trading volume is distributed across prices. This allows you to identify key areas of
Weis Wave Double Side Alert
Eduardo Da Costa Custodio Santos
The Weis Wave Bouble Side Indicator for MT5 is part of the toolkit (Wyckoff Academy Wave Market) The Weis Wave Bouble side Indicator for MT5 was created based on the already established Weis Wave created by David Weis. The Weis Wave Double Side indicator reads the market in waves as R. Wyckoff did in 1900. It helps in the identification of effort x result, cause and effect, and Supply and demand Its differential is that it can be used below the zero axis and has a breakout alert showing Who is s
Quick deals EA
Aleksandr Slavskii
Горячие клавиши плюс клик левой кнопки мыши на графике. Советник открывает сделки, выставляет лимитные и стоповые ордера, удаляет ордера и закрывает позиции, также  делает реверс  открытых позиций, выставляет прописанные в настройках стоп лосс и тейк профит. (реверс только на неттинговых счетах) При запуске советника можно посмотреть подсказку как действует советник при нажатии клавиши + клик на графике. Правее последнего бара, ниже цены Ctrl+ЛКМ  - OpenSell Правее последнего бара, выше цены
Here I present you this awesome indicator I made. This is a nique combination witch puts you in the same level as MM's. So you can surf a lot of waves and identify the rally time, breakouts, and the perfect time to get in the market. ---- The SSL Channel is a great all-rounder based on 2 Simple Moving Averages, one of recent Highs, one of recent Lows. The calculation prints a   channel   on the chart consisting of 2 lines. This strategy gives a Long signal when price closes above the top of the
Supply and Demand Indicator + FREE Currency Strength Meter ADD-ON Looking for a powerful tool that can help you identify the most reactive zones in the forex market? Our supply and demand indicator for MetaTrader 4 and 5 is exactly what you need. With its advanced algorithms and real-time analysis, this indicator helps traders of all experience levels make informed trading decisions. The supply and demand indicator is a cutting-edge tool that helps traders identify areas where buyers and sellers
Waves PRO
Flavio Javier Jarabeck
For those who appreciate Richard Wyckoff approach for reading the markets, we at Minions Labs designed a tool derived - yes, derived, we put our own vision and sauce into this indicator - which we called Waves PRO . This indicator provides a ZigZag controlled by the market volatility (ATR) to build its legs, AND on each ZigZag leg, we present the vital data statistics about it. Simple and objective. This indicator is also derived from the great book called " The Secret Science of Price and Volum
Volume and MarketProfile Pro
Raphael Lorenz Baumgartner
Volume and MarketProfile Pro Description: The MarketProfile Indicator provides precise and detailed analysis of trading volume across different price levels. It calculates and displays the volume profile for each trading day, helping you understand market structure and volume distribution to make informed trading decisions. Key Features: Daily Volume Analysis: The indicator calculates and displays the volume profile for each trading day, allowing you to easily identify volume distribution across
An anchored Vwap With Arrows is an indicator that includes a moving average weighted by volume that allows you to plot on a bottom or a top. Usually banks and institutions measure an average price, this average price is a price range where they agree to make a trade. Using the logic of anchored vwap with arrows it is possible to understand that if the price breaks the vwap it means that someone with enough buying and selling power has lost control. You can use vwap anchored with arrows in any ti
This is Gekko's Cutomized Cutomized Average Directional Index (ADX), a customized version of the famous ADX indicator. Use the regular ADX and take advantage two entry signals calculations and different ways of being alerted whenever there is potential entry or exit point. Inputs Period: Period for the ADX calculation; PlotSignalType: How will the indicator calculate entry (swing) signals: 1- ShowSwingsOnTrendLevel : Show Signals for Trend Confirmation Swings; 2- ShowSwingsOnTrendLevelDirectio
Best SAR MT5
Ashkan Hazegh Nikrou
5 (1)
Description :  we are happy to introduce our new free indicator based on one of professional and popular indicators in forex market (Parabolic SAR) this indicator is new modification on original Parabolic SAR indicator, in pro SAR indicator you can see cross over between dots and price chart, this crossover is not signal but talk about end of movement potential, you can start buy by new blue dot, and place stop loss one atr before first blue dot, and finally you can exit as soon as dots cross
FREE
Zeus Indicator MT5
Lo Thi Mai Loan
3 (1)
Introducing the Zeus Indicator: Your Ultimate Profit-Breakthrough Trading Tool. This indicator simplifies trading, eliminating the need for in-depth analysis with breakout strategies. It automatically draws zones based on your preset timeframes, suggests Stop Loss (SL), Take Profit (TP), and Trailing Stop levels. The Zeus Indicator will promptly notify you and display signal arrows as the price approaches buy or sell entry points. It also offers recommendations for four different take profi
Was: $249  Now: $99   Market Profile defines a number of day types that can help the trader to determine market behaviour. A key feature is the Value Area, representing the range of price action where 70% of trading took place. Understanding the Value Area can give traders valuable insight into market direction and establish the higher odds trade. It is an excellent addition to any system you may be using. Inspired by Jim Dalton’s book “Mind Over Markets”, this indicator is designed to suit the
Hull Moving Average MT5
Maestri Investment Group Ltd.
5 (1)
We value your feedback and believe that your experience with the Hull Moving Average (HMA) is essential to us and other traders. Help us continue to improve and refine our product by sharing your thoughts and insights through a review! The Hull Moving Average (HMA) Indicator – Your Key to Smoother Trends and Profitable Trades! Are you tired of lagging and choppy moving averages that hinder your ability to spot profitable trading opportunities? Look no further! The Hull Moving Average (HMA) is
FREE
Market Cycle and Trading Sessions
Maximiliano Frisione Figueroa
Market Cycle and Trading Sessions Indicator Introducing our Market Cycle and Trading Sessions Indicator, a tool designed to provide you with a comprehensive view of the financial market like never before. Observe the market's pulse with our exclusive indicator. Gain a deep understanding of market phases, from accumulation to distribution, to make informed, strategic decisions with a high probability. What makes our indicator? 1. Date Range for Calculations: Customize the start and end da
FREE
Wapv Price and volume
Eduardo Da Costa Custodio Santos
The WAPV Price and Volume Indicator for MT5 is part of the ( Wyckoff Academy Wave Market ) and (Wyckoff Academy Price and Volume) toolset. The WAPV Price and Volume Indicator for MT5 was created to make it easy to visualize the volume movement on the chart in an intuitive way. With it you can observe the moments of peak volume and moments when the market has no professional interest Identify moments when the market is moving by inertia and not by movement of "smart money". It consists of 4 color
Forex Volume MT5
KEENBASE SOFTWARE SOLUTIONS
KT Forex Volume shows the buying and selling volume of a currency pair in the form of a colored histogram. The volume is made of buying and selling transactions in an asset. In FX market: If the buying volume gets bigger than the selling volume, the price of a currency pair would go up. If the selling volume gets bigger than the buying volume, the price of a currency pair would go down. Features Avoid the bad trades by confirming them using the tick volume data. It helps you to stay on the si
The new update makes this indicator a complete tool for studying, analyzing and operating probabilistic patterns. It includes: On-chart Multi-asset percentage monitor. Configurable martingales. Twenty-one pre-configured patterns, including Mhi patterns and C3. An advanced pattern editor to store up to 5 custom patterns. Backtest mode to test results with loss reports. Trend filter. Hit operational filter. Martingale Cycles option. Various types of strategies and alerts. Confluence between patter
Valle Depth Of Market
Rafael Judson Lima Valle
A depth of market product is a powerful trading tool that provides a comprehensive view of the supply and demand levels for a particular financial instrument. It provides traders with a real-time display of all the buy and sell orders that are currently available in the market, allowing them to make more informed trading decisions based on the most up-to-date information available. With Valle Depth Of Market , traders can see not only the best bid and ask prices, but also the volume of orders at
The TimeCycleCaptor indicator is an innovative tool for accurately visualizing the market trend and generating buy and sell signals. The market trend plays a key role in making trading decisions, and our indicator provides a reliable tool for determining it. We have made traders' dream of non-lagging moving averages come true in our indicator. TimeCycleCaptor is capable of predicting future values ​​and is designed to both identify the underlying trend and identify short-term buy or sell si
Buyers of this product also purchase
Atomic Analyst MT5
Issam Kassas
4.6 (20)
First of all Its worth emphasizing here that this Trading Indicator is   Non-Repainting   , Non Redrawing and Non Lagging Indicator   Indicator, Which makes it ideal from both manual and robot trading.  User manual: settings, inputs and strategy . The Atomic Analyst  is a PA Price Action Indicator that uses Strength and Momentum of the price to find a better edge in the market. Equipped with Advanced filters which help remove noises and false signals, and Increase Trading Potential. Using Mult
First of all Its worth emphasizing here that this Trading System is Non-Repainting   , Non Redrawing and Non Lagging Indicator Which makes it ideal from both manual and robot trading .  Online course, manual and download presets. The Smart Trend Trading System MT5 is a comprehensive trading solution tailored for new and experienced traders . It combines over 10 premium indicators and features more than 7 robust trading strategies , making it a versatile choice for diverse market conditions . Tre
TPSpro RFI Levels MT5
Roman Podpora
4.67 (9)
Reversal First Impulse levels (RFI)      INSTRUCTIONS        RUS       -       ENG              R ecommended to use with an indicator   -   TPSpro  TREND PRO -  Version MT4                 A key element in trading is zones or levels from which decisions to buy or sell a trading instrument are made. Despite attempts by major players to conceal their presence in the market, they inevitably leave traces. Our task was to learn how to identify these traces and interpret them correctly. Main functi
TPSproTREND PrO MT5
Roman Podpora
4.89 (9)
TPSpro TREND PRO  - is a trend indicator that automatically analyzes the market and provides information about the trend and each of its changes, as well as giving signals for entering trades without redrawing! The indicator uses each candle, analyzing them separately. referring to different impulses - up or down impulse. Exact entry points into transactions for currencies, crypto, metals, stocks, indices!  Version MT4               DETAILED DESCRIPTION               R ecommended to use with an
Quantum Trend Sniper
Bogdan Ion Puscasu
4.92 (48)
Introducing   Quantum Trend Sniper Indicator , the groundbreaking MQL5 Indicator that's transforming the way you identify and trade trend reversals! Developed by a team of experienced traders with trading experience of over 13 years,   Quantum Trend Sniper Indicator   is designed to propel your trading journey to new heights with its innovative way of identifying trend reversals with extremely high accuracy. ***Buy Quantum Trend Sniper Indicator and you could get Quantum Breakout Indicator fo
Top indicator for MT5   providing accurate signals to enter a trade without repainting! It can be applied to any financial assets:   forex, cryptocurrencies, metals, stocks, indices .  Watch  the video  (6:22) with an example of processing only one signal that paid off the indicator! MT4 version is here It will provide pretty accurate trading signals and tell you when it's best to open a trade and close it. Most traders improve their trading results during the first trading week with the help of
FX Power MT5 NG
Daniel Stein
5 (6)
Trading GOLD, and currencies, with the dog walk strategy  - super smart Trading GOLD, and currencies, with the breakout strategy  - super easy Visit our all-new   Stein Investments Welcome Page   to get the latest information, updates and trading strategies. FX Power MT5 NG  is the next generation of our long-time very popular currency strength meter, FX Power.  And what does this next-generation strength meter offer? Everything you have loved about the original FX Power  PLUS GOLD/XAU st
First of all Its worth emphasizing here that this Trading Tool is Non Repainting , Non Redrawing and Non Lagging Indicator , Which makes it ideal for professional trading . Online course, user manual and demo. The Smart Price Action Concepts Indicator is a very powerful tool for both new and experienced traders . It packs more than 20 useful indicators into one , combining advanced trading ideas like Inner Circle Trader Analysis and Smart Money Concepts Trading Strategies . This indicator focus
FX Volume MT5
Daniel Stein
4.94 (17)
Visit our all-new   Stein Investments Welcome Page   to get the latest information, updates and trading strategies. FX Volume is the FIRST and ONLY volume indicator that provides a REAL insight into the market sentiment from a broker's point of view. It provides awesome insights into how institutional market participants, like brokers, are positioned in the Forex market, much faster than COT reports. Seeing this information directly on your chart is the real game-changer and breakthrough solut
TrendMaestro5
Stefano Frisetti
note: this indicator is for METATRADER4, if you want the version for METATRADER5 this is the link:  https://www.mql5.com/it/market/product/108106 TRENDMAESTRO ver 2.4 TRENDMAESTRO recognizes a new TREND in the bud, he never makes mistakes. The certainty of identifying a new TREND is priceless. DESCRIPTION TRENDMAESTRO identifies a new TREND in the bud, this indicator examines the volatility, volumes and momentum to identify the moment in which there is an explosion of one or more of these data a
How many times have you bought a trading indicator with great back-tests, live account performance proof with fantastic numbers and stats all over the place but after using it, you end up blowing your account? You shouldn't trust a signal by itself, you need to know why it appeared in the first place, and that's what RelicusRoad Pro does best! NOW $147 (increasing to $499 after a few updates) - UNLIMITED ACCOUNTS (PCs or MACs) **  User Manual + Strategies + Training Videos + Private Group with
XQ Indicator MetaTrader 5
Marzena Maria Szmit
3.5 (2)
Step into the realm of Forex trading with confidence and precision using XQ, a cutting-edge Forex indicator designed to elevate your trading game to unprecedented heights. Whether you're a seasoned trader or just stepping into the world of currency exchange, XQ Forex Indicator empowers you with the insights and signals needed to make informed trading decisions. The signal conditions are a combination of three indicators, and XQ Forex Indicator only display  medium and long-term trends . The ind
Trend Hunter MT5
Andrey Tatarinov
5 (1)
Trend Hunter is a trend indicator for working in the Forex, cryptocurrency, and CFD markets. A special feature of the indicator is that it confidently follows the trend, without changing the signal when the price slightly pierces the trend line. The indicator is not repaint; a signal to enter the market appears after the bar closes. When moving along a trend, the indicator shows additional entry points in the direction of the trend. Based on these signals, you can trade with a small StopLoss. Tr
This dashboard shows the latest available   harmonic patterns   for the selected symbols, so you will save time and be more efficient /   MT4 version . Free Indicator:   Basic Harmonic Pattern Comparison of "Basic Harmonic Pattern" vs. "Basic Harmonic Patterns Dashboard" Indicators Feature Basic Harmonic Pattern Basic Harmonic Patterns Dashboard Functionality Detects and displays harmonic patterns on a single chart Searches multiple symbols and timeframes for harmonic patterns, displays
Volume by Price MT5
Brian Collard
3.6 (5)
The Volumebyprice.com Indicator for MetaTrader 5 features Volume Profile and Market Profile TPO (Time Price Opportunity). Volume and TPO histogram bar and line charts. Volume Footprint charts. TPO letter and block marker collapsed and split structure charts. Static, dynamic and flexible range segmentation and compositing methods with relative and absolute visualizations. Session hours filtering and segment concatenation with Market Watch and custom user specifications. Graphical layering, posit
Volatility Trend System - a trading system that gives signals for entries. The volatility system gives linear and point signals in the direction of the trend, as well as signals to exit it, without redrawing and delays. The trend indicator monitors the direction of the medium-term trend, shows the direction and its change. The signal indicator is based on changes in volatility and shows market entries. The indicator is equipped with several types of alerts. Can be applied to various trading in
Advanced Supply Demand MT5
Bernhard Schweigert
4.53 (15)
Best Solution for any Newbie or Expert Trader! This indicator is a unique, high quality and affordable trading tool because we have incorporated a number of proprietary features and a new formula. With this update, you will be able to show double timeframe zones. You will not only be able to show a higher TF but to show both, the chart TF, PLUS the higher TF: SHOWING NESTED ZONES. All Supply Demand traders will love it. :) Important Information Revealed Maximize the potential of Advanced Suppl
Matrix Arrow Indicator MT5
Juvenille Emperor Limited
5 (14)
Matrix Arrow Indicator MT5  is a unique 10 in 1 trend following   100% non-repainting  multi-timeframe indicator that can be used on all symbols/instruments:   forex,   commodities,   cryptocurrencies,   indices,   stocks .  Matrix Arrow Indicator MT5  will determine the current trend at its early stages, gathering information and data from up to 10 standard indicators, which are: Average Directional Movement Index (ADX) Commodity Channel Index (CCI) Classic Heiken Ashi candles Moving Aver
Gartley Hunter Multi
Siarhei Vashchylka
5 (8)
Gartley Hunter Multi - An indicator for searching for harmonic patterns simultaneously on dozens of trading instruments and on all possible timeframes. Manual (Be sure to read before purchasing) | Version for MT4 Advantages 1. Patterns: Gartley, Butterfly, Shark, Crab. Bat, Alternate Bat, Deep Crab, Cypher 2. Simultaneous search for patterns on dozens of trading instruments and on all possible timeframes 3. Search for patterns of all possible sizes. From the smallest to the largest 4. A
Blahtech Supply Demand MT5
Blahtech Limited
4.54 (13)
Was: $299  Now: $99   Supply Demand uses previous price action to identify potential imbalances between buyers and sellers. The key is to identify the better odds zones, not just the untouched ones. Blahtech Supply Demand indicator delivers functionality previously unavailable on any trading platform. This 4-in-1 indicator not only highlights the higher probability zones using a multi-criteria strength engine, but also combines it with multi-timeframe trend analysis, previously confirmed swings
Order Block Hunter MT5
Noha Mohamed Fathy Younes Badr
5 (1)
Order block hunter indicator is the best indicator for  hunt the order blocks that area where there has been a large concentration of limit orders waiting to be executed Order blocks are identified on a chart by observing previous price action and looking for areas where the price experienced significant movement or sudden changes in direction .This indicator does that for you by using very complicated codes and helps you to take the best areas To buy and sell because it make marks at the best a
Native Channels
BeeXXI Corporation
5 (2)
This indicator recognizes all support and resistance levels. A number of unique high-performance techniques have been applied, which made the existence of this indicator possible. All formed channels are naturally visible: horizontal linear linear parabolic cubic (Polynomial 3 degrees - Wave) This is due to a bundle of approximating channels. The formed channels form "standing waves" in a hierarchical sequence. Thus, all support and resistance levels are visible. All parameter management is
Auto Order Block with break of structure based on ICT and Smart Money Concepts (SMC) Futures Break of Structure ( BoS )             Order block ( OB )            Higher time frame Order block / Point of Interest ( POI )    shown on current chart           Fair value Gap ( FVG ) / Imbalance   -  MTF      ( Multi Time Frame )    HH/LL/HL/LH  -  MTF      ( Multi Time Frame )  Choch  MTF      ( Multi Time Frame )  Volume Imbalance     ,  MTF          vIMB Gap’s Power of 3 Equal High
AW Trend Predictor MT5
AW Trading Software Limited
4.78 (58)
The combination of trend and breakdown levels in one system. An advanced indicator algorithm filters market noise, determines the trend, entry points, as well as possible exit levels. Indicator signals are recorded in a statistical module, which allows you to select the most suitable tools, showing the effectiveness of the signal history. The indicator calculates Take Profit and Stop Loss marks. Manual and instruction ->  HERE  / MT4 version ->  HERE How to trade with the indicator:  Trading wit
Owl Smart Levels MT5
Sergey Ermolov
4.31 (39)
MT4 version  |   FAQ The Owl Smart Levels Indicator is a complete trading system within the one indicator that includes such popular market analysis tools as Bill Williams' advanced fractals , Valable ZigZag which builds the correct wave structure of the market, and Fibonacci levels which mark the exact levels of entry into the market and places to take profits. Detailed description of the strategy Instructions for working with the indicator Advisor-assistant in trading Owl Helper Private User
Elliot Waves Analyzer Pro
Viktor Weidenthal
3.25 (4)
Elliot Waves Analyzer Pro calculates Elliot Waves to Help Identify Trend direction and Entry Levels. Mainly for Swing Trading Strategies. Usually one would open a Position in trend direction for Wave 3 or a Correction for Wave C . This Indicator draws Target Levels for the current and next wave. Most important Rules for Elliot Wave Analysis are verified by the Indicator.  The Pro version analyzes Multiple Timeframes and shows the Subwaves and Target-Levels.   For an Overview  " Elliot Waves Anal
Introducing   Quantum Breakout PRO , the groundbreaking MQL5 Indicator that's transforming the way you trade Breakout Zones! Developed by a team of experienced traders with trading experience of over 13 years,   Quantum Breakout PRO   is designed to propel your trading journey to new heights with its innovative and dynamic breakout zone strategy. Quantum Breakout Indicator will give you signal arrows on breakout zones with 5 profit target zones and stop loss suggestion based on the breako
TrendDecoder Premium MT5
Christophe Pa Trouillas
5 (2)
Identify ranges  | Get earliest signals of Trends  | Get clear exits before reversal  | Spot the Fibo levels the price will test   |  Non-repainting, non-delayed indicator - ideal for manual and automated trading - for all assets and all time units $69   for launch - then back to >>   $149 After purchase,   please contact me on this channel   for recommended and personalised settings MT4   version:  Click here Get our full method with  BladeSCALPER  and   PowerZONES What is it about? TrendDE
Bill Williams Advanced
Siarhei Vashchylka
5 (8)
Bill Williams Advanced is designed for automatic chart analysis using Bill Williams' "Profitunity" system. The indicator analyzes four timeframes at once. Manual (Be sure to read before purchasing) Advantages 1. Automatically analyzes the chart using the "Profitunity" system of Bill Williams. The found signals are placed in a table in the corner of the screen. 2. Equipped with a trend filter based on the Alligator indicator. Most of the system signals are recommended to be used only accordi
Trend Master Pro MT5
Tatiana Zyrianova
4.67 (3)
MT5 trend indicator with a probability of reaching a profit of 70-90%! Works without redrawing and delays. Trend Master PRO shows good results on all trading instruments: currencies, metals, indices, stocks, cryptocurrencies. Recommended timeframe: H1-H4. More information about the indicator is here :  https://www.mql5.com/en/blogs/post/744748 Recommendations for use Use automatic period detection           The main feature of the indicator is the self-optimization function.             Th
More from author
AI Channel
Thalles Nascimento De Carvalho
4 (4)
Welcome to the presentation of the AI Channel indicator, a powerful tool that uses artificial intelligence for price channel analysis in the financial market. In this session, we will explore how this revolutionary indicator can assist investors and traders in making more informed and strategic decisions. Let's get started! I. What is the AI Channel indicator? AI Channel is an indicator developed based on advanced artificial intelligence algorithms. It utilizes historical price data of financial
FREE
Master OBV FX
Thalles Nascimento De Carvalho
5 (1)
MasterOBV: Master Market Trends with Precision! The MasterOBV is a technical analysis indicator that combines volume , positive correlation , and a Moving Average (MA) to refine trend identification in financial markets. Key Features: Smart Volume: Analyzes trading volume to identify significant changes in trend strength. Positive Correlation: Incorporates correlated assets for a broader and more accurate view, reinforcing the potential for price displacement based on pair volume.
FREE
CVD SmoothFlow
Thalles Nascimento De Carvalho
CVD SmoothFlow - Simplify Volume Analysis with Precision for BTCUSD! CVD SmoothFlow is a technical indicator developed specifically for traders operating the BTCUSD pair. Using Cumulative Volume Delta (CVD) calculation, it applies advanced noise filtering, providing a clear and accurate market reading. What does CVD SmoothFlow offer? Clear Analysis: Filters market noise, allowing you to focus on the most relevant and significant volume movements. ️ Precise Calculation: Monitors the differ
FREE
Long Short
Thalles Nascimento De Carvalho
4.67 (3)
Long & Short Indicator: The Ultimate Tool for Market Movement Analysis High Hit Rate with Real-Time Information Track asset movements with high accuracy and base your decisions on up-to-date data. ️ Safer Trade Entries Leverage positive and negative correlations to make more secure and informed trade entries. Facilitates Short and Long-Term Reading Ideal for both short and long-term strategies, adapting to your trading needs. Alert Option for Specific Levels Enable alerts
FREE
Swing Point Volume
Thalles Nascimento De Carvalho
Swing Point Volume, the indicator that signals weakness and strength at the tops and bottoms. This indicador can be for used the Wyckoff Method. Information provided; - Swing on customized ticks. - Volume and points in each balance sheet. - Percentage of Displacement. - Sound alert option on top and bottom breaks. - Volume in ticks and Real Volume. - Volume HL (extreme) or (opening and closing) - Customized volume shapes.
Atr Projection
Thalles Nascimento De Carvalho
The ATR Projection Indicator stands out as a robust tool in technical analysis, designed to provide accurate insights into potential price movement limits in the financial market. Its flexible approach allows users to customize analysis metrics intuitively, adapting to the specific needs of each traded asset. Customizable Operation: By default, the ATR Projection operates considering 30% of the average of the last 100 candles. This flexibility enables users to adjust metrics according to t
Box Weis Wave
Thalles Nascimento De Carvalho
5 (1)
Elevate Your Analysis with the Weis Wave Box! If you’re looking for precision and clarity in your trading, the Weis Wave Box is the tool you need. This advanced indicator offers a detailed visual analysis of volume waves and swing points, helping you better understand the relationship between effort and results in the market. Key Features of the Weis Wave Box: Customizable Volume Waves: Adjust volume waves in ticks to fit your trading strategies. Adjustable History: Focus on specific
Long Short Pro
Thalles Nascimento De Carvalho
Long & Short Indicator - Pro Version: Unlock Unlimited Market Analysis Potential! No Restrictions for Any Asset The Pro version of the Long & Short Indicator offers complete freedom to use it on any financial asset. No more limits - apply the same indicator to all your favorite assets! No Restrictions Enjoy all the features of the indicator with no limitations. The Pro version provides a full, unrestricted experience, allowing you to maximize every market opportunity. Pro Versi
Reversal Vol Propagation
Thalles Nascimento De Carvalho
Are you tired of missing out on trading opportunities by not being able to identify price reversals in time? Do you want to maximize your profits and make informed trading decisions? Introducing the Reversal Vol Propagation Indicator, the revolutionary tool that uses neural networks and volume data to predict potential price reversals. Based on a powerful combination of advanced algorithms and cutting-edge technology, the Reversal Vol Propagation meticulously analyzes volume patterns and past pr
Didi Index Volume
Thalles Nascimento De Carvalho
Introducing the Didi Index Volume, a technical analysis indicator developed by Brazilian trader Odir Aguiar, which stands out for its advanced and powerful approach in identifying opportunities in the financial market. Available on various platforms, the Didi Index Volume has become an essential tool for traders seeking precise insights and valuable information for their trading strategies. The indicator combines the renowned Didi Index, created by Odir Aguiar, with intelligent use of trading v
Smart Binary Volume
Thalles Nascimento De Carvalho
The Smart Binary Volume indicator is a versatile tool that combines trading volume analysis with machine learning. It can be applied to various markets and strategies, including scalping and other short-term trading approaches. Using advanced machine learning algorithms, the indicator identifies complex patterns, generating more precise buy and sell signals. Usage tips: 1. Attention when the lines are opposite: Pay attention to situations where the lines of the Smart Binary Volume indicato
TimeChannel
Thalles Nascimento De Carvalho
The "Timechannel" is a powerful technical analysis tool designed specifically for traders who want to gain deeper and more accurate insights into price movements across multiple timeframes (multi-timeframe). This indicator is an essential addition to the toolbox of any serious trader seeking to make informed and data-driven trading decisions. Key Features: Advanced Multi-Timeframe Analysis : Timechannel allows traders to analyze price movements on different timeframes simultaneously. This is cr
Big Player Range
Thalles Nascimento De Carvalho
5 (2)
Discover the Power of "BigPlayerRange": Your Ally in Market Technical Analysis Introducing BigPlayerRange , an advanced technical analysis tool designed to reveal institutional interest areas in the market. With it, you'll precisely identify where major players are actively engaged and how this can impact your trading strategies. Key Features: Mapping Institutional Interest Areas : BigPlayerRange highlights zones of high institutional activity, providing valuable insights into potential m
Master OBV
Thalles Nascimento De Carvalho
MasterOBV: Master Market Trends with Precision! The MasterOBV is a technical analysis indicator that combines volume , positive correlation , and a Moving Average (MA) to refine trend identification in financial markets. Key Features: Smart Volume: Analyzes trading volume to identify significant changes in trend strength. Positive Correlation: Incorporates correlated assets for a broader and more accurate view, reinforcing the potential for price displacement based on pair volume.
Smart Delta Volume
Thalles Nascimento De Carvalho
Smart Delta Volume: Precise and Adaptable to Dynamic Market Conditions The Smart Delta Volume is an advanced technical indicator designed to offer precise and adaptable analysis in the face of constant market changes. By utilizing dynamic levels that automatically adjust to volatility, this indicator provides a more comprehensive and reliable view of the interplay between volume flow and price action. This adaptability is crucial for traders seeking quick and accurate insights, especially in
VolaMetrics VSA
Thalles Nascimento De Carvalho
VolaMetrics VSA | A Powerful Ally in Technical Analysis The VolaMetrics VSA is a technical analysis indicator that combines the Volume Spread Analysis (VSA) methodology with detailed analysis of trading volume . Designed to identify and track significant price movements , VolaMetrics VSA uses the interaction between volume and price spread to provide valuable insights that can aid in trading decisions. Fundamentals of Volume Spread Analysis (VSA) Volume Spread Analysis (VSA) is a respected
SwingVolumePro
Thalles Nascimento De Carvalho
Overview The SwingVolumePro is an advanced and versatile indicator, designed to be applied to a wide range of financial assets and support different trading styles. Developed based on rigorous volume and price analysis, it offers clear and precise signals that allow traders of all levels to make informed decisions based on high-quality data. Key Features Versatility: SwingVolumePro can be applied to various assets, including stocks, forex, cryptocurrencies, and more. It is suitable for
CVD SmoothFlow Pro
Thalles Nascimento De Carvalho
CVD SmoothFlow Pro - Unlimited Volume Analysis for Any Asset! CVD SmoothFlow Pro is the ultimate solution for traders seeking precise and unlimited volume analysis. Utilizing Cumulative Volume Delta (CVD) with advanced noise filtering, the Pro Version provides the flexibility and precision needed to trade any financial asset. What does CVD SmoothFlow Pro offer? Clear Analysis : Filters out noise and highlights significant volume movements across any financial asset. ️ Precise Calculation
Filter:
traderspeed
318
traderspeed 2023.10.19 16:28 
 

User didn't leave any comment to the rating

Aleks_91
107
Aleks_91 2023.10.16 14:51 
 

User didn't leave any comment to the rating

Thalles Nascimento De Carvalho
6048
Reply from developer Thalles Nascimento De Carvalho 2023.10.16 14:55
Спасибо за отзыв, индикатор для умных людей (флоу не для новичков)
Reply to review
Version 1.5 2023.10.16


1. A smart level has been added that automatically tracks the cumulative delta and its direction.

2. We've synchronized the signals from the order book with the volume delta.
Version 1.4 2023.10.15
The purchase and sale volumes were added, along with the current Delta sign.
Version 1.3 2023.10.15
A notification has been added for cases where the chart displays candles without volume data or with identical opening and closing prices. The solution is to change the timeframe or bar history to collect the data correctly and display the indicator with adjusted calculations.