• Overview
  • Reviews
  • Comments
  • What's new

Session Volume Profile

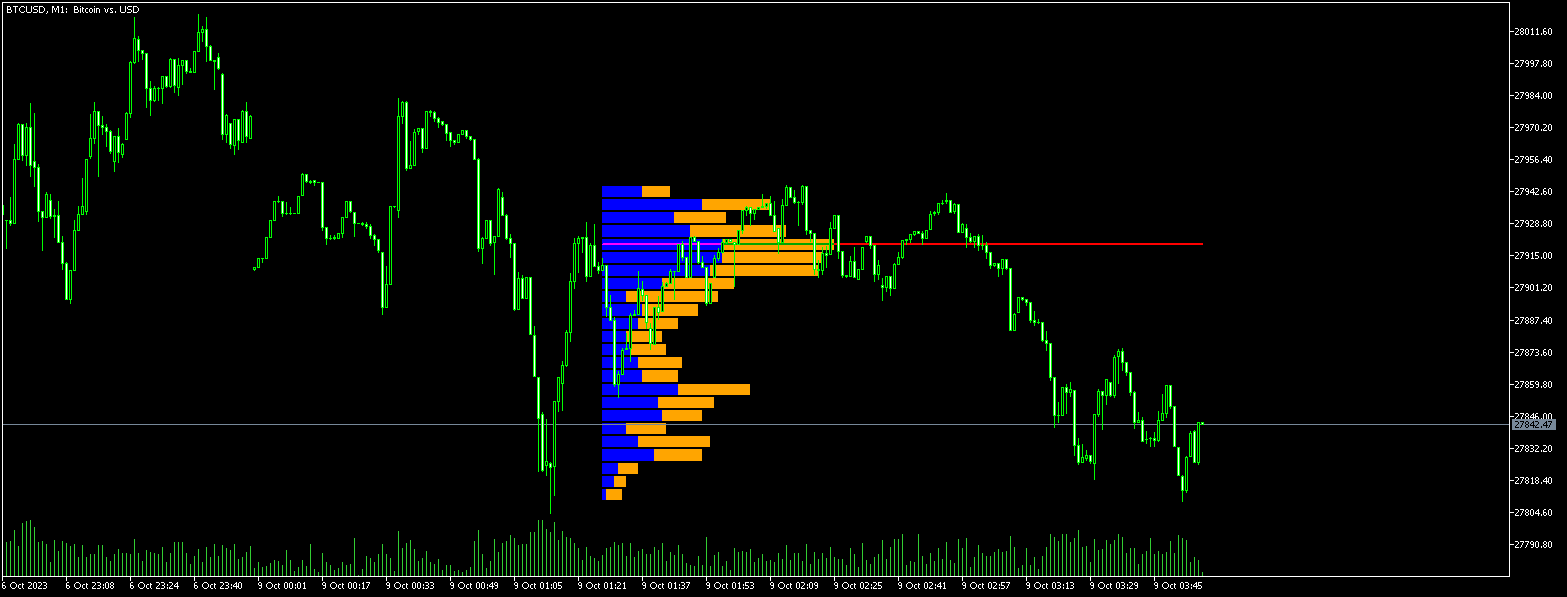
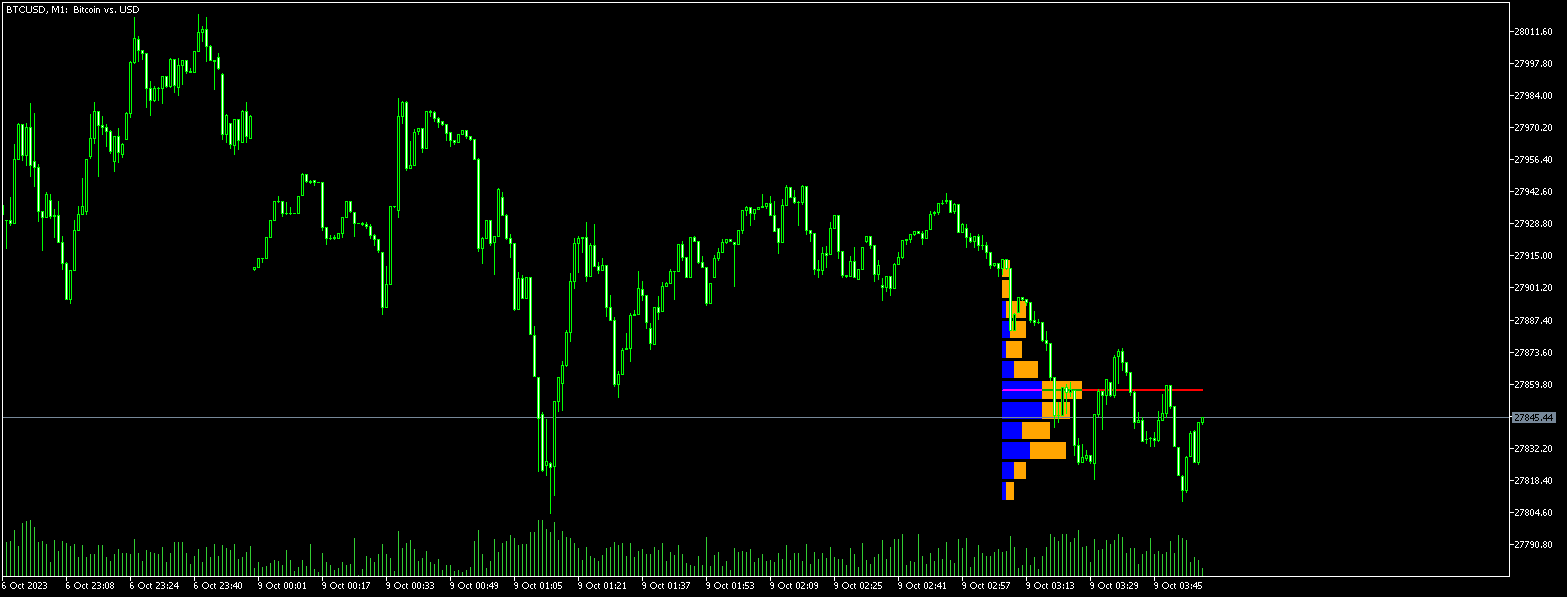
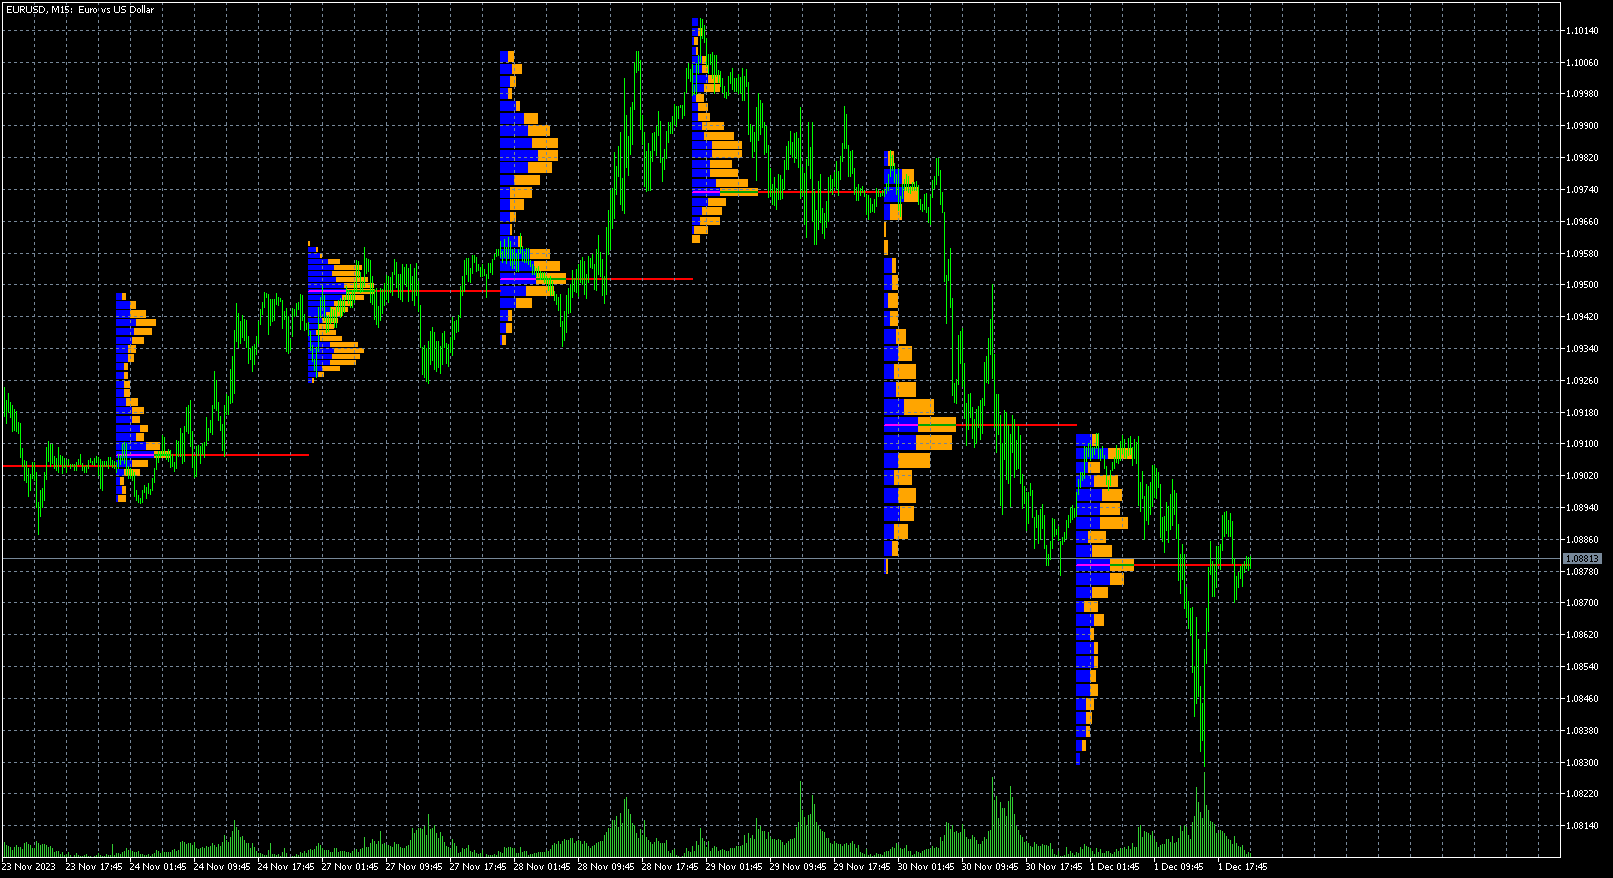
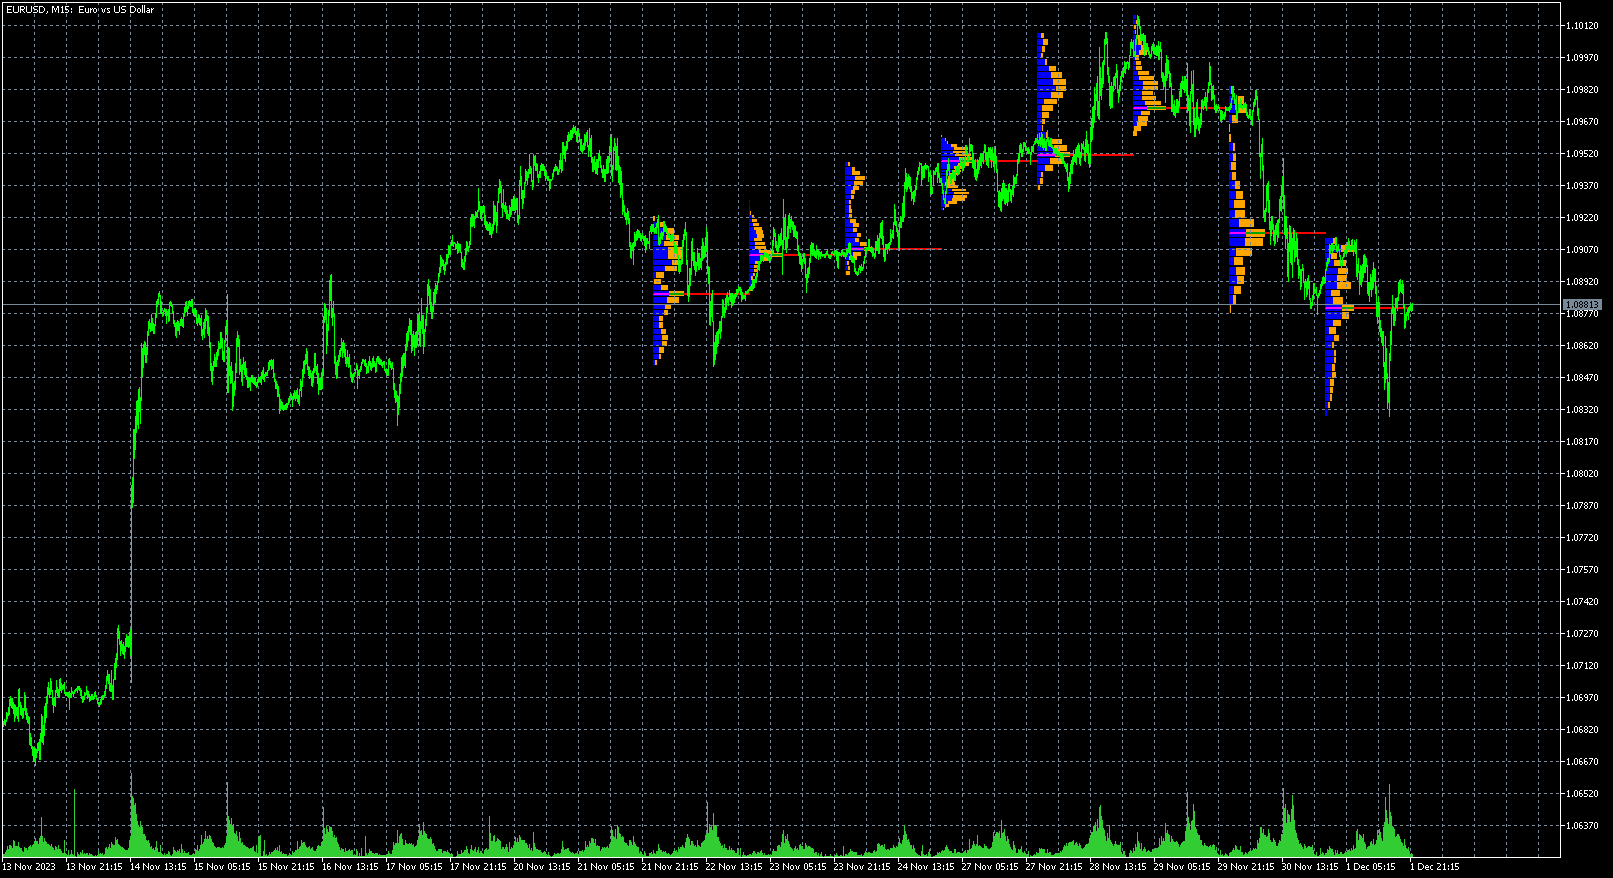
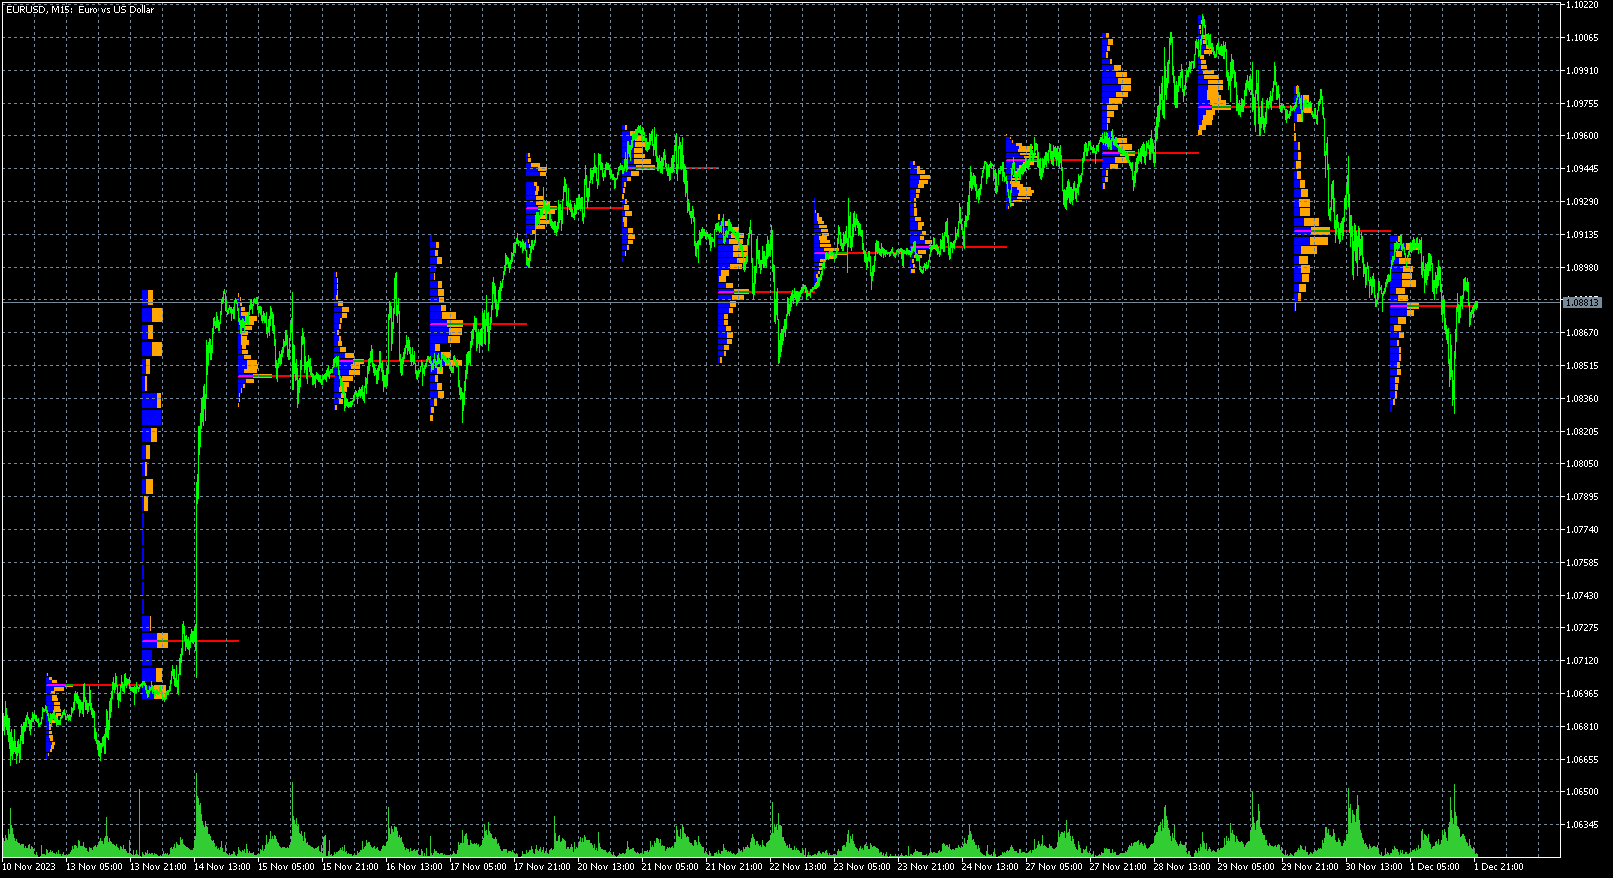
The Session Volume Profile indicator displays the distribution of trade volume across price levels for a specific trading session. It visualizes areas of high and low trading activity, helping traders identify support and resistance zones. The profile's peak, known as the Point of Control (POC), represents the price with the highest traded volume.


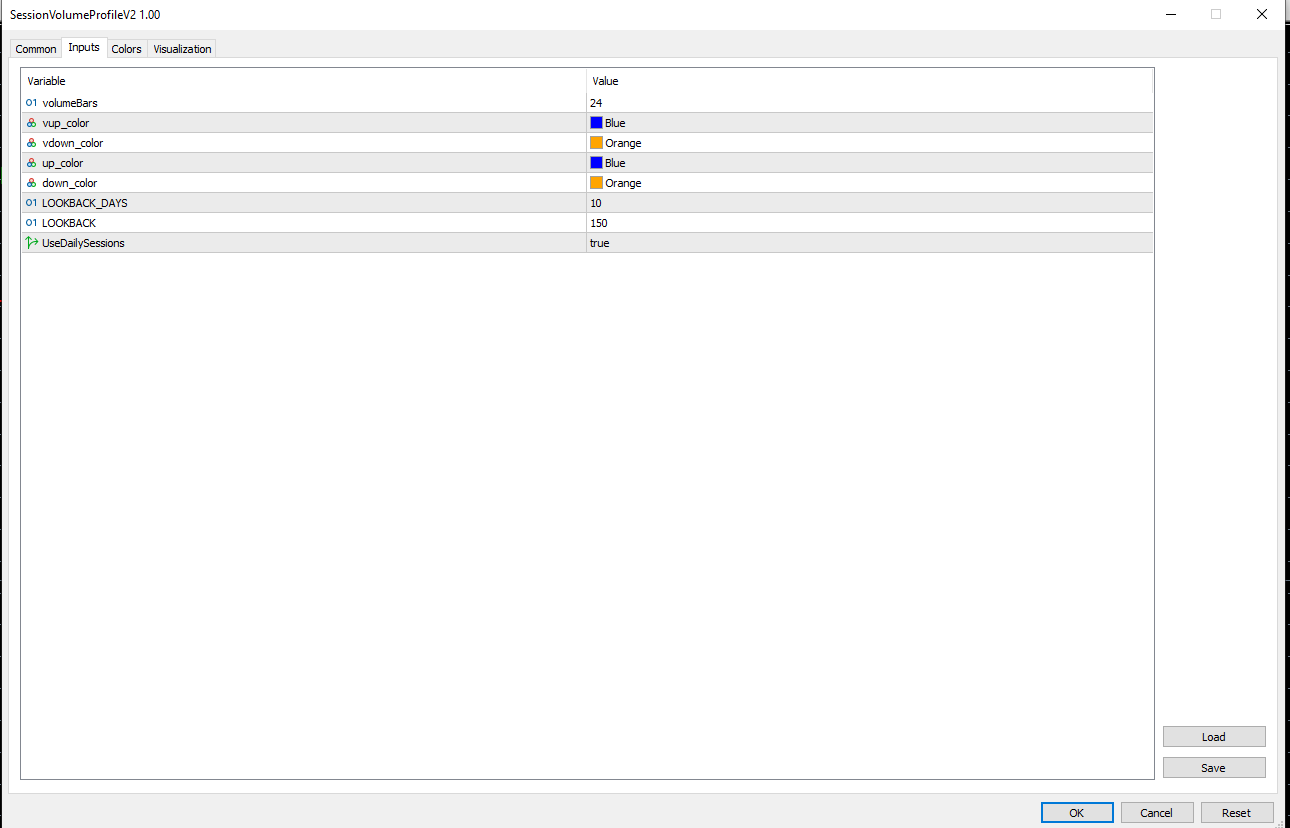
The inputs of the indicator:

  1. volumeBars(Row Size): Determines the number of price bins or rows for the volume profile. A larger number results in finer granularity.
  2. vup_color: Color for the volume of "up" bars within the value area.
  3. vdown_color: Color for the volume of "down" bars within the value area.
  4. up_color: Color for the volume of "up" bars outside the value area.
  5. down_color: Color for the volume of "down" bars outside the value area.
  6. LOOKBACK: The number of bars the indicator analyzes to compute the volume profile.


Recommended products
This product is designed for the MT5 platform and offers two key features: VWAP (Volume Weighted Average Price) calculation and Volume Profile analysis. Advantages: VWAP Calculation: The product calculates the VWAP, which is a popular indicator used by traders to determine the average price of a security based on its trading volume. It helps identify potential buying or selling opportunities by comparing the current price to the average price weighted by volume. Volume Profile Analysis: The prod
GRat Clusters  is an indicator that shows various data in the form of clusters on a price chart: volume, delta, ratio of sales and purchases, etc. It allows you to visually see the market profile in real time and on history at a given depth. Capabilities 1.8 types of cluster data: volume, delta, purchases   and sales , volume and delta, imbalance between sales and purchases , volume profile, delta profile, buy and sell profile. 2. A cluster period can be either any available in MT5 timeframe or
Session Volume Profile  is an advanced graphical representation that displays trading activity during Forex trading sessions at specified price levels. The Forex market can be divided into four main trading sessions: the Australian session, the Asian session, the European session and the favorite trading time - the American (US) session. POC  - profile can be used as a support and resistance level for intraday trading. VWAP  - Volume Weighted Average Price. ATTENTION  ! For the indicator to
PTS Demand Index MT5
PrecisionTradingSystems
PTS Demand Index code by Precision Trading Systems Demand Index was the creation of James Sibbet and uses complex code to make simple work of the interpretation of volume and price as a combination. Understanding volumes is never an easy task but this beautiful piece of programming certainly makes like a lot easier. There are several ways in which this indicator can benefit traders and investors alike. Divergences (As a Leading indicator) Having studied many technical indicators over the years
MA Speedometer MT5
Davit Beridze
5 (3)
Non standard attitude to the standard moving average indicator. The essence of the indicator is to determine the strength and speed of the price direction by determining the tilt angle of the moving average. A point is taken on the fifteenth MA candle and a point on the last closed MA candle, a straight line is drawn between them, it is movable and on a hemisphere shows an angle of inclination from 90 degrees to -90. above 30 degrees is the buying area, below -30 degrees is the selling area. abo
This indicator anticipates price reversals analyzing bullish and bearish pressure in the market. The buying pressure is the sum of all the accumulation bars over a certain number of days, multiplied by the volume. The selling pressure is the sum of all of the distribution over the same number of bars, multiplied by the volume. [ Installation Guide | Update Guide | Troubleshooting | FAQ | All Products ] The indicator ratio gives you a measure of the buying pressure as a percentage of the total ac
WT Vwap 5 Bands
Ricardo Almeida Branco
5 (1)
WT Vwap 5 Bands The WT Vwap Bands indicator is an indicator that combines price and volume, helping to show whether the price is within the "fair price", overbought or oversold. The indicator code was designed for performance and has already been tested in a real trading account. In addition to the visual inputs (color, thickness and line style), the user can define a% value that depends on the price. The default values work with the most distant band at 1% of the price and then di
Do you use volume in your reading of the market? Certainly many traders use it, and do not imagine operating without it. The Color Histogram Volume Set indicator allows the user to choose the value that he considers interesting to monitor. When you pass this you will have visual confirmation and if you want you will also have the audible alert that is given by the indicator. Of course, there are other ways to try to find a high volume, such as assessing whether the volume
6-BAND VWAP (Volume Weighted Average Price) Fully customized and EA-friendly VWAP Bands Indicator. Main Features: Choose the period of VWAP calculation reset (Daily, Weekly or Monthly): For day trading use the Daily VWAP, and for longer term analysis use the Weekly or Monthly calculations. Choose how many bands (deviations) you want to show, up to 6. Choose zero to display only the main VWAP line. Fine adjustment of the deviation of the bands: Find the best band’s deviation for the in
UR VolumeTrend MT5
Krzysztof Jan Debski
UR VolumeTrend MT5   UR  VolumeTrend MT5 is the clearest volume indicator showing the ongoing trend in terms of volume. Works perfectly with other indicators just like UR TrendExhaustion to signal local tops and bottoms. Limited to just 2 parameters - the higher values, the longer trends it will show.  Gradient extremes show possible exhaustions of volume to catch a potential reversal. Two lines - The Volume trend and It's average. The best advantage: Easy and adjusted to all assets. There is a
Mean Reversion Supply Demand Indicator Mean Reversion Supply Demand is the indicator to detect the important supply demand zone in your chart. The concept of supply demand trading relies on the quantity mismatching between buying and selling volumes in the financial market. Typically, supply demand zone serves to predict the turning point. The wave pattern, for any supply demand zone to work as an successful trade, looks like the price must touch the base zone, move away and then return to zone
This indicator is based on the discrete Hartley transform. Using this transformation allows you to apply different approaches when processing financial time series. A distinctive feature of this indicator is that its readings refer not to one point on the chart, but to all points of the indicator period. When processing a time series, the indicator allows you to select various elements of the time series. The first possibility of filtering is built on this approach - all unnecessary high-freque
VolumeDeltaWaves
Stanislav Korotky
5 (1)
This indicator is an extended implementation of Weis waves. It builds Weis waves on absolute volumes (which is the classical approach) or delta of volumes (unique feature) using different methods of wave formation and visualization. It works with real volumes, if available, or with tick volumes otherwise, but also provides an option to use so called "true volume surrogates", as an artificial substitution for missing real volumes (for example, for Forex symbols), which was introduced in correspo
Blahtech VWAP MT5
Blahtech Limited
5 (1)
Was: $69  Now: $34   Blahtech VWAP - Volume Weighted Average Price (VWAP) is the ratio of price to total volume. It provides an average price over a specified time interval.  Links [  Install  |  Update  |  Documentation   ] Feature Highlights Configurable VWAP Line Sessions, intervals, anchored or continuous Previous day settlement line Standard Deviation bands Alerts at bar close or real time Automatic Broker or Tick volumes Significantly reduced CPU usage Input Parameters Expert Advisor
Reverse side scalper is the manual trading system, that works on choppy(anti-trend) market. As a rule markets are on 80% choppy and only 20% is trend phase. System is based on custom step Moving and RSI and reverse pattern. System defines up movement, down movement, trend / choppy phases. Indicator plots Buy signal arrow when current direction is down and phase is trend, Sell signal arrow is plotted when currently is up movement and phase is trend. As a rule it allows to "catch" local maximum/mi
Visual Heatmap Book Analyzer
Alexandre Moraes De Souza Lima
Visual Heatmap Book Analyser This indicator monitors the market liquidity and generates colors based on order patterns, quantities, and renewal activities in the book. This allows you to visualize the order flow and identify areas of high and low liquidity and activity. The indicator uses machine learning techniques to analyze the order behavior in the book, enabling it to detect patterns and trends in orders, allowing you to make informed decisions about your trading operations. The color pal
This indicator will show a vertical representation of the volume distribution within a selected user range. For a free demo version go to   https://www.mql5.com/en/market/product/42482 . Main features: This Indicator will create an image that will allow viewing the tick volume per price level in a graphical form. The indicator will work on any range size in any time-frame, limited only by your computer memory and performance. Recommended time-frames are: M1 to H1. Inputs: Price Calculated -
Value Chart Candlesticks
Flavio Javier Jarabeck
4.67 (9)
The idea of a Value Chart indicator was presented in the very good book I read back in 2020 , " Dynamic Trading Indicators: Winning with Value Charts and Price Action Profile ", from the authors Mark Helweg and David Stendahl. The idea is simple and the result is pure genius: Present candlestick Price analysis in a detrended way! HOW TO READ THIS INDICATOR Look for Overbought and Oversold levels. Of course, you will need to test the settings a lot to find the "correct" one for your approach.
FREE
Hello; This indicator provides input and output signals of real volume levels with some mathematical calculations. It is simple and safe to use. As a result of the intersection of real volume levels with averages, it creates buy and count signals. Indicator parameter descriptions: A-PERIOD: Indicates the number of bars to be calculated. B-GAMMA: A fixed Fibonacci trend average of 0.618 is used. Use C-VOLUME TYPE:Tick volume as a constant. D-HIGH LEVEL 2: Represents the level of the
Session Control
Vitalii Zakharuk
Session Control session indicator. Depending on from which continent the trading activity takes place in a certain period, the entire daily routine is divided into several trading sessions. Due to the fact that at each separate time interval exchange and banking platforms from different parts of the world are connected to the trading process, and the Forex market operates around the clock. There are 4 main trading sessions: Pacific. European. American. Asian. This indicator allows you t
ATR Zone MT5
Sergey Ermolov
ATR is an important indicator for any financial market. The abbreviation ATR stands for Average True Range. This indicator is a tool to determine the volatility of the market, this is its direct purpose. ATR shows the average price movement for the selected period of time. The initial price of the indicator is 63$. The price will increase every 10 sales   up to 179$ The original ATR indicator is present in many trading programs. The ATR indicator is not very informative, so I modified its data a
XOATRHIST 5
Ainur Sharipov
3 (1)
Version for MetaTrader 5. The indicator is based on point and figure chart, but their period is equal to ATR indicator values. Displays in the form of steps. Steps above zero indicate an uptrend. Below zero on a downtrend. Parameters: ATRPeriod - ATR period for calculation of steps. Note: The indicator uses closes price, thus it is recommended to consider completed bars.
TPO Profile MT5
Kyra Nickaline Watson-gordon
Definition : TPO is a Time Price Opportunity. Instead of using bars or candles with an Open, High, Low, and Close price, each "bar" in a Market Profile is represented by horizontal bars against the price It is called Market Profile terminology. In other words time-price-opportunity (TPO) profiles are histograms of how much time was spent at each price within the span of the profile. By using a TPO chart, you are able to analyze the amount of trading activity, based on time, for each price leve
Delta B3 ATR Renko Scalper é um robô especialista para negociação na Bolsa Brasileira B3 , em contratos de mini índice WIN e mini dólar WDO. O robô é programado para utilizar os cálculos Renko como análise de tendência e também como sinal de entrada, podendo operar como scalper , emitindo diversas ordens ( CUIDADO com os lotes e número de ordens!). O tamanho do Renko pode ser fixo ou variável de acordo com o indicador ATR (Average True Range) , possibilitando maior dinamismo ao robô. Os stops (
Forex Volume MT5
KEENBASE SOFTWARE SOLUTIONS
KT Forex Volume shows the buying and selling volume of a currency pair in the form of a colored histogram. The volume is made of buying and selling transactions in an asset. In FX market: If the buying volume gets bigger than the selling volume, the price of a currency pair would go up. If the selling volume gets bigger than the buying volume, the price of a currency pair would go down. Features Avoid the bad trades by confirming them using the tick volume data. It helps you to stay on the si
The best time to trade Using this Indicator is when the time reach exactly hour,half,45 minutes,15 minutes and sometimes 5 minutes.. This indicators is helpful to those who trade boom and crash indecies.How to read this indicator first you'll see Blue allow and Red allow all these allows used to indicate or to detect the spike which will happen so the allow happens soon before the spike happen.This indicator works properly only in boom and crash trading thing which you have to consider when
WAPV Weis Wave Chart Forex
Eduardo Da Costa Custodio Santos
The Weis Wave Chart Forex for MT5 is a Price and Volume indicator. The Price and Volume reading was widely disseminated through Richard Demille Wyckoff based on the three laws created by him: Supply and Demand, Cause and Effect and Effort vs. Result. In 1900 R.Wyckoff already used the wave chart in his analyses. Many years later, around 1990, David Weis Automated R. Wyckoff's wave chart and today we bring you the evolution of David Weis' wave chart. It shows the amount of Volume and the amount o
This indicator will show you the TP and SL Values (in that currency) that you already set  for every orders on the charts  ( closed to the transaction/order line)  that will help you a lot to estimated your profit and loss for every order.    And it also show you the PIPs values too.  the shown format  is      " Currency Values of our Profit or Loss /  PIPs values ".    The TP Value will be shown in Green Color and  the SL Value  will be shown in Red Color.  For any question or more information,
Quick deals EA
Aleksandr Slavskii
Горячие клавиши плюс клик левой кнопки мыши на графике. Советник открывает сделки, выставляет лимитные и стоповые ордера, удаляет ордера и закрывает позиции, также  делает реверс  открытых позиций, выставляет прописанные в настройках стоп лосс и тейк профит. (реверс только на неттинговых счетах) При запуске советника можно посмотреть подсказку как действует советник при нажатии клавиши + клик на графике. Правее последнего бара, ниже цены Ctrl+ЛКМ  - OpenSell Правее последнего бара, выше цены
Stock Trader Pro MT5
Ivan Pochta
5 (10)
=====  Live Results ==== >>>   Stock Trader Pro:  here >>  (IC Markets) =====  Presets ==== >>> Stock Trader Pro v.1.2 Presets:   Download >> Stock Trader Pro   is a fully automated trading advisor designed to work at   US Stock Market . The system is based on the author’s trading strategy. Unlike Forex systems,   Stock Trader Pro   opens only LONG positions by  the global direction of trend on price on price falls (dips), analyzing data from several timeframes at the same time. The trading s
Buyers of this product also purchase
Atomic Analyst MT5
Issam Kassas
5 (14)
First of all Its worth emphasizing here that this Trading Indicator is   Non-Repainting   , Non Redrawing and Non Lagging Indicator   Indicator, Which makes it ideal from both manual and robot trading.  User manual: settings, inputs and strategy . The Atomic Analyst  is a PA Price Action Indicator that uses Strength and Momentum of the price to find a better edge in the market. Equipped with Advanced filters which help remove noises and false signals, and Increase Trading Potential. Using Mult
First of all Its worth emphasizing here that this Trading System is Non-Repainting   , Non Redrawing and Non Lagging Indicator Which makes it ideal from both manual and robot trading .  Online course, manual and download presets. The Smart Trend Trading System MT5 is a comprehensive trading solution tailored for new and experienced traders . It combines over 10 premium indicators and features more than 7 robust trading strategies , making it a versatile choice for diverse market conditions . Tre
FX Power MT5 NG
Daniel Stein
5 (5)
Trading GOLD, and currencies, with the dog walk strategy  - super smart Trading GOLD, and currencies, with the breakout strategy  - super easy Visit our all-new   Stein Investments Welcome Page   to get the latest information, updates and trading strategies. FX Power MT5 NG  is the next generation of our long-time very popular currency strength meter, FX Power.  And what does this next-generation strength meter offer? Everything you have loved about the original FX Power  PLUS GOLD/XAU st
Quantum Trend Sniper
Bogdan Ion Puscasu
4.91 (43)
Introducing   Quantum Trend Sniper Indicator , the groundbreaking MQL5 Indicator that's transforming the way you identify and trade trend reversals! Developed by a team of experienced traders with trading experience of over 13 years,   Quantum Trend Sniper Indicator   is designed to propel your trading journey to new heights with its innovative way of identifying trend reversals with extremely high accuracy. ***Buy Quantum Trend Sniper Indicator and you could get Quantum Breakout Indicator fo
Reversal First Impulse levels (RFI)      INSTRUCTIONS        RUS       -       ENG              R ecommended to use with an indicator   -   TREND PRO -  Version MT4                 A key element in trading is zones or levels from which decisions to buy or sell a trading instrument are made. Despite attempts by major players to conceal their presence in the market, they inevitably leave traces. Our task was to learn how to identify these traces and interpret them correctly. Main functions:: Di
First of all Its worth emphasizing here that this Trading Tool is Non Repainting , Non Redrawing and Non Lagging Indicator , Which makes it ideal for professional trading . Online course, user manual and demo. The Smart Price Action Concepts Indicator is a very powerful tool for both new and experienced traders . It packs more than 20 useful indicators into one , combining advanced trading ideas like Inner Circle Trader Analysis and Smart Money Concepts Trading Strategies . This indicator focus
Gold Stuff mt5
Vasiliy Strukov
4.89 (178)
Gold Stuff mt5 is a trend indicator designed specifically for gold and can also be used on any financial instrument. The indicator does not redraw and does not lag. Recommended time frame H1. Contact me immediately after the purchase to get   personal bonus!  You can get a free copy of our Strong Support and Trend Scanner indicator, please pm. me! Settings  and manual   here   SETTINGS Draw Arrow - on off. drawing arrows on the chart. Alerts -   on off audible alerts. E-mail notification - on of
FX Volume MT5
Daniel Stein
4.94 (17)
Visit our all-new   Stein Investments Welcome Page   to get the latest information, updates and trading strategies. FX Volume is the FIRST and ONLY volume indicator that provides a REAL insight into the market sentiment from a broker's point of view. It provides awesome insights into how institutional market participants, like brokers, are positioned in the Forex market, much faster than COT reports. Seeing this information directly on your chart is the real game-changer and breakthrough solut
TPSproTREND PrO MT5
Roman Podpora
4.88 (8)
TPSpro TRENDPRO  - is a trend indicator that automatically analyzes the market and provides information about the trend and each of its changes, as well as giving signals for entering trades without redrawing! The indicator uses each candle, analyzing them separately. referring to different impulses - up or down impulse. Exact entry points into transactions for currencies, crypto, metals, stocks, indices!  -  Version MT4               DETAILED DESCRIPTION               R ecommended to use with
FxaccurateLS
Shiv Raj Kumawat
WHY IS OUR FXACCCURATE LS MT5 THE PROFITABLE ? PROTECT YOUR CAPITAL WITH RISK MANAGEMENT Gives entry, stop and target levels from time to time. It finds Trading opportunities by analyzing what the price is doing during established trends. POWERFUL INDICATOR FOR A RELIABLE STRATEGIES We have made these indicators with a lot of years of hard work. It is made at a very advanced level. Established trends provide dozens of trading opportunities, but most trend indicators completely ignore them!
Volume by Price MT5
Brian Collard
5 (4)
The Volume by Price Indicator for MetaTrader 5 features Volume Profile and Market Profile TPO (Time Price Opportunity). Volume and TPO histogram bar and line charts. Volume Footprint charts. TPO letter and block marker collapsed and split structure charts. Session filtering and grouping. Static, dynamic and flexible range segmentation and compositing methods with relative and absolute visualizations. Graphical layering, positioning and styling options to suit the user's analytic and aesthetic n
AW Trend Predictor MT5
AW Trading Software Limited
4.78 (58)
The combination of trend and breakdown levels in one system. An advanced indicator algorithm filters market noise, determines the trend, entry points, as well as possible exit levels. Indicator signals are recorded in a statistical module, which allows you to select the most suitable tools, showing the effectiveness of the signal history. The indicator calculates Take Profit and Stop Loss marks. Manual and instruction ->  HERE  / MT4 version ->  HERE How to trade with the indicator:  Trading wit
ICT, SMC, SMART MONEY CONCEPTS, SMART MONEY, Smart Money Concept, Support and Resistance, Trend Analysis, Price Action, Market Structure, Order Blocks, BOS/CHoCH,   Breaker Blocks ,  Momentum Shift,   Supply&Demand Zone/Order Blocks , Strong Imbalance, HH/LL/HL/LH,    Fair Value Gap, FVG,  Premium  &   Discount   Zones, Fibonacci Retracement, OTE, Buy Side Liquidity, Sell Side Liquidity, BSL/SSL Taken, Equal Highs & Lows, MTF Dashboard, Multiple Time Frame, BigBar, HTF OB, HTF Market Structure, 
Quantum Heiken Ashi PRO MT5
Bogdan Ion Puscasu
4.5 (8)
Introducing the Quantum Heiken Ashi PRO charts with integrated alerts Designed to provide clear insights into market trends, the Heiken Ashi candles are renowned for their ability to filter out noise and eliminate false signals. Say goodbye to confusing price fluctuations and hello to a smoother, more reliable chart representation. What makes the Quantum Heiken Ashi PRO truly unique is its innovative formula, which transforms traditional candlestick data into easy-to-read colored bars. Red and g
Legacy of Gann for MT5
Pavel Zamoshnikov
5 (6)
The indicator very accurately determines the levels of the possible end of the trend and profit fixing. The method of determining levels is based on the ideas of W.D.Gann, using an algorithm developed by his follower Kirill Borovsky. Extremely high reliability of reaching levels (according to K. Borovsky  - 80-90%) Indispensable for any trading strategy – every trader needs to determine the exit point from the market! Precisely determines targets on any timeframes and any instruments (forex, met
"Piranha" - an autonomous trading system that determines overbought and oversold levels on the chart. Red and blue zones represent overbought and oversold levels respectively. Entry points are marked with arrows: a downward arrow in the red zone for "sell" and an upward arrow in the blue zone for "buy". The Take profit level is indicated by the green moving average. Key features: Adjusting the Take profit level as the green moving average changes position. Averaging ability when a new market e
Top indicator for MT5   providing accurate signals to enter a trade without repainting! It can be applied to any financial assets:   forex, cryptocurrencies, metals, stocks, indices .  Watch  the video  (6:22) with an example of processing only one signal that paid off the indicator! MT4 version is here It will provide pretty accurate trading signals and tell you when it's best to open a trade and close it. Most traders improve their trading results during the first trading week with the help of
Bill Williams Advanced
Siarhei Vashchylka
5 (5)
Bill Williams Advanced is designed for automatic chart analysis using Bill Williams' "Profitunity" system. The indicator analyzes four timeframes at once. Manual (Be sure to read before purchasing) Advantages 1. Automatically analyzes the chart using the "Profitunity" system of Bill Williams. The found signals are placed in a table in the corner of the screen. 2. Equipped with a trend filter based on the Alligator indicator. Most of the system signals are recommended to be used only accordi
TPA True Price Action indicator reveals the true price action of the market makers through 100% non-repainting signals strictly at the close of a candle! TPA shows entries and re-entries, every time the bulls are definitely stronger than the bears and vice versa. Not to confuse with red/green candles. The shift of power gets confirmed at the earliest stage and is ONE exit strategy of several. There are available now two free parts of the TPA User Guide for our customers. The first "The Basics"
Best Solution for any Newbie or Expert Trader! This Indicator is a unique, high quality and affordable trading tool because we have incorporated a number of proprietary features and a new formula. With only ONE chart you can read Currency Strength for 28 Forex pairs! Imagine how your trading will improve because you are able to pinpoint the exact trigger point of a new trend or scalping opportunity? User manual:   click here That's the first one, the original! Don't buy a worthless wannabe clone
This dashboard shows the latest available   harmonic patterns   for the selected symbols, so you will save time and be more efficient /   MT4 version . Free Indicator:   Basic Harmonic Pattern Indicator columns Symbol:  the selected symbols will appear Trend:   bullish or bearish Pattern:  type of pattern (gartley, butterfly, bat, crab, shark, cypher or ABCD) Entry:  entry price SL:  stop loss price TP1:   1st take profit price TP2:  2nd take profit price TP3:  3rd take profit price Current
MTF Supply Demand Zones MT5
Georgios Kalomoiropoulos
Next Generation Of Automated Supply And Demand Zones. New and Innovative Algorithm that Works At Any Chart. All Zones Are Being Created Dynamically According To Price Action Of The Market. AMAZING OFFER --> Activations from 5 to 20 for "MTF Supply Demand Zones" and "Automated Trendlines" TWO TYPES OF ALERTS -->  1) WHEN PRICE HITS A ZONE    2)WHEN A NEW ZONE IS FORMED  If you get the MTF Supply Demand Zones you can join the " Trade Like Me " Video Series. It contains 14 Live Sessions wh
AW Prime Oscillator MT5
AW Trading Software Limited
A combination of two oscillators. The first one displays the entry points, the second shows the current trend . The indicator can display oscillator signals by arrows in two modes, all fast oscillator signals or signals only in the direction of the current trend. It has a multi-timeframe panel and three types of signal notifications. Benefits: Suitable for day and scalping trading Trend filtering Simple and sensitive setup Multi-timeframe panel Suitable for integration into an advisor. Works on
Owl Smart Levels MT5
Sergey Ermolov
4.38 (37)
MT4 version  |   FAQ The Owl Smart Levels Indicator is a complete trading system within the one indicator that includes such popular market analysis tools as Bill Williams' advanced fractals , Valable ZigZag which builds the correct wave structure of the market, and Fibonacci levels which mark the exact levels of entry into the market and places to take profits. Detailed description of the strategy Instructions for working with the indicator Advisor-assistant in trading Owl Helper Private User
Introducing the South African Sniper indicator created by a small group of traders with a few years trading trading the financial market profitably . This is a plug and play indicator that provides you with  BUY and SELL (SNIPER ENTRY) signals with TARGET and trail stops. The indicator Works with all MT5 trading instruments. The indicator uses previous  chart data as receipt to speculate on future market moves.  "The South African Sniper indicator community are very happy with the indicator an
Best Solution for any Newbie or Expert Trader! This indicator is a unique, high quality and affordable trading tool because we have incorporated a number of proprietary features and a secret formula. With only ONE chart it gives Alerts for all 28 currency pairs. Imagine how your trading will improve because you are able to pinpoint the exact trigger point of a new trend or scalping opportunity! Built on new underlying algorithms it makes it even easier to identify and confirm potential trades.
Italo Trend Indicator MT5
Italo Santana Gomes
4.89 (9)
BUY INDICATOR AND GET EA FOR FREE AS A BONUS + SOME OTHER GIFTS! ITALO TREND INDICATOR  is the best trend indicator on the market, the Indicator works on all time-frames and assets, indicator built after 7 years of experience on forex and many other markets. You know many trend indicators around the internet are not complete, does not help, and it's difficult to trade, but the Italo Trend Indicator is different , the Italo Trend Indicator shows the signal to buy or sell, to confirm the signal t
AW Breakout Catcher MT5
AW Trading Software Limited
5 (9)
Breakdowns of price levels, advanced statistics, TakeProfit calculation and 3 types of notifications. Benefits:  Do not redraw your results Signal strictly at the close of the candle False Breakdown Filtering Algorithm It goes well with any trending strategy. Works on all tools and timeseries Manual and instruction ->  HERE  / Problem solving ->  HERE  / MT4 version ->  HERE How to trade with the indicator  Trading with AW Breakout Catcher in just three easy steps: Step 1 - Opening a position A
XQ Indicator MetaTrader 5
Marzena Maria Szmit
5 (1)
Step into the realm of Forex trading with confidence and precision using XQ, a cutting-edge Forex indicator designed to elevate your trading game to unprecedented heights. Whether you're a seasoned trader or just stepping into the world of currency exchange, XQ Forex Indicator empowers you with the insights and signals needed to make informed trading decisions. The signal conditions are a combination of three indicators, and XQ Forex Indicator only display  medium and long-term trends . The ind
Malaysian SNR Levels
Matthias Horst Pieroth
This indicator can be used to display Support and Resistance levels according to  the  Malaysian SNR concept , in which Support and Resistance are exact levels of a line chart. Malaysian SNR There are 3 different horizontal levels in Malaysian SNR: A-Level : This level is located at the peak of this line chart. (shape looks like the letter A) V-Level : Level at the valley of a line chart, (shape looks like the letter V) Gap-Leve l: This level is located at the Close/Open gap between two cand
More from author
VuizAlgo CyberQuantum Nexus is an innovative Expert Advisor designed for MetaTrader 5 that intelligently combines the power of the Relative Strength Index (RSI) with a color-coded Exponential Moving Average (EMA) to capitalize on market reversals. This EA is engineered to meticulously monitor market conditions, waiting for indications of a potential reversal. This strategic approach allows for precision trading, targeting entries that coincide with the beginning of a trend, thus maximizing th
The "Rsi Neural Quant" Expert Advisor (EA) represents a cutting-edge approach to automated trading on the MetaTrader 5 platform. At its core, this EA employs a singular neuron neural network, a simple yet powerful form of artificial intelligence, to interpret signals from the Relative Strength Index (RSI) indicator for making informed trading decisions. This innovative tool is designed for traders seeking to leverage AI in their trading strategies, but it requires careful optimization before u
GridMatter: Your Gateway to Trend Reversal Mastery Unlock the power of precision trading with GridMatter , the Expert Advisor designed to navigate the ebbs and flows of the Forex market with ease. Built on a foundation of sophisticated trend reversal strategies, GridMatter utilizes a harmonious blend of the RSI, dual moving averages, and ATR indicators to pinpoint optimal entry and exit points. Why GridMatter? Trading isn't just about the decisions you make; it's about the tools you use. GridMat
Quantum Grid EA: Elevating Your Trading Strategy Introducing Quantum Grid EA, a forefront in automated trading technology. Developed with precision and a deep understanding of the Forex market's dynamics, Quantum Grid EA offers traders a sophisticated tool designed to enhance their trading strategy through advanced algorithms and a robust grid system. Discover Quantum Grid EA's Advanced Features: Innovative Technology : Utilizing a foundation similar to the neural network approach of Aura White
Filter:
No reviews
Reply to review
Version 2.0 2023.12.04
Added the functionality that allows user to change from a Fixed Volume Profile to a Session Volume Profile.