RAD Real Acummulation and Distribution
- Indicators
- Jose Alejandro Jacome Jimenez
- Version: 1.1
- Updated: 27 October 2023
- Activations: 5
RAD CRITICAL LEVES
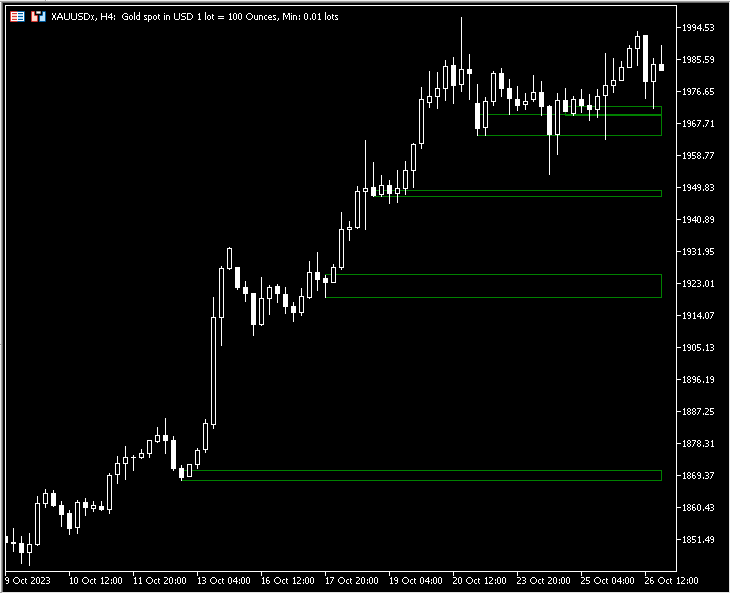
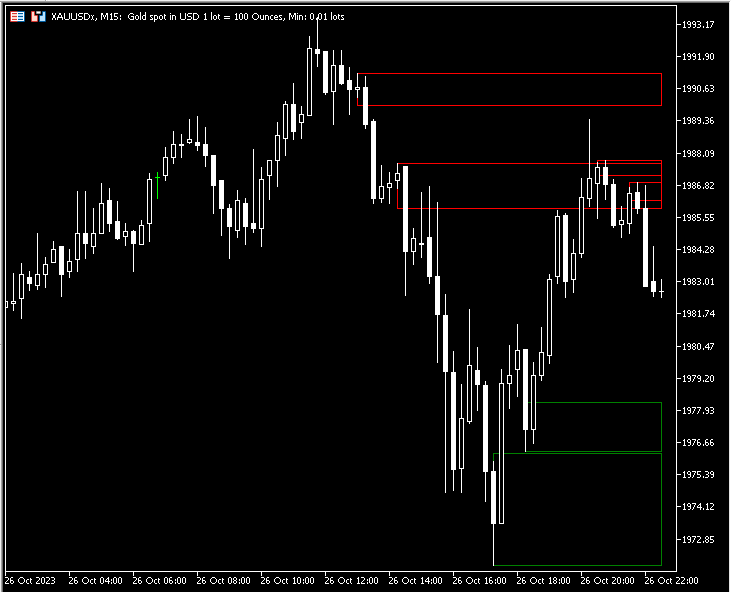
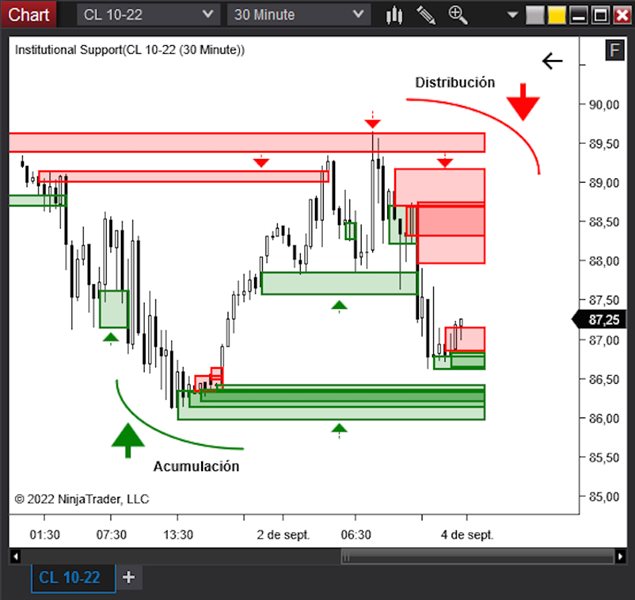
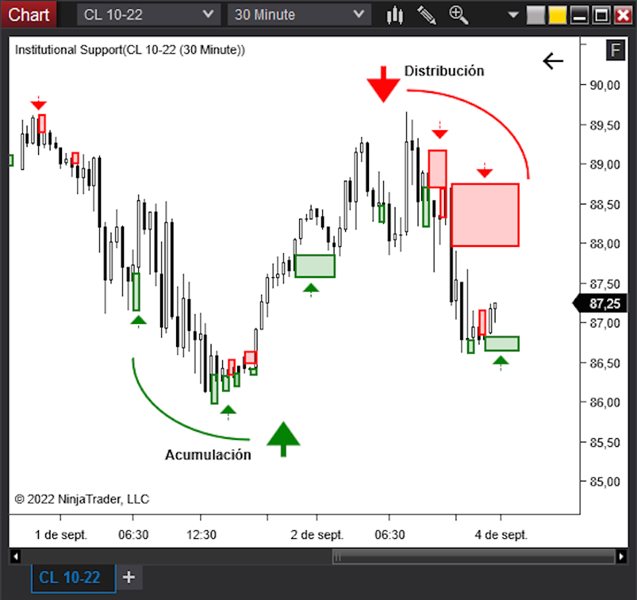
RAD indicator tracks “Relevant Volume” in real time, identifying accumulation and distribution processes, projecting them in the chart as SUPPORT or RESISTANCE zones.
Natural support and resistance levels are generated by Volume Accumulation and Distribution processes. As these processes evolve, levels at which the relevant volume in the market place is positioned, become difficult areas to cross upwards or downwards.
By using this information, traders can identify very sensitive areas where there is a high probability that the price will reverse its direction or support itself to continue in line with the original trend.
These levels or zones are known as “CRITICAL LEVELS”.
----
TRADING BENEFITS
§ Does not require experience for its use or interpretation.
§ It identifies natural support or resistance zones in the market.
§ Identifies areas where demand or supply is generated.
§ There is a high probability that the price will rebound significantly from these zones.
§ In the event that the price exceeds the identified area, the price will surely extend to the next accumulation or distribution zone.
§ Works on any asset and o any time frame.

