Trend Correction Histogram m
- Indicators
- DMITRII GRIDASOV
- Version: 1.7
- Updated: 27 March 2024
- Activations: 10
Crypto_Forex Indicator "Trend Correction Histogram" for MT4.
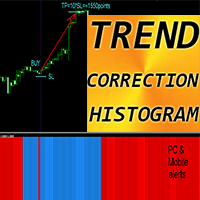
- Trend Correction Histogram can be in 2 colors: red for bearish trend and blue for bullish one.
- 7 consecutive histogram columns of the same color means beginning of new trend.
- Trend Correction Histogram indicator designed with the main purpose - to minimize losses and maximize profit.
- It has parameter - "Period", responsible for indicator's sensitivity.
- Built-in Mobile and PC alerts.
- Trend Correction Histogram can be use as a simple but profitable trading system, See below:
HOW TO USE indicator:
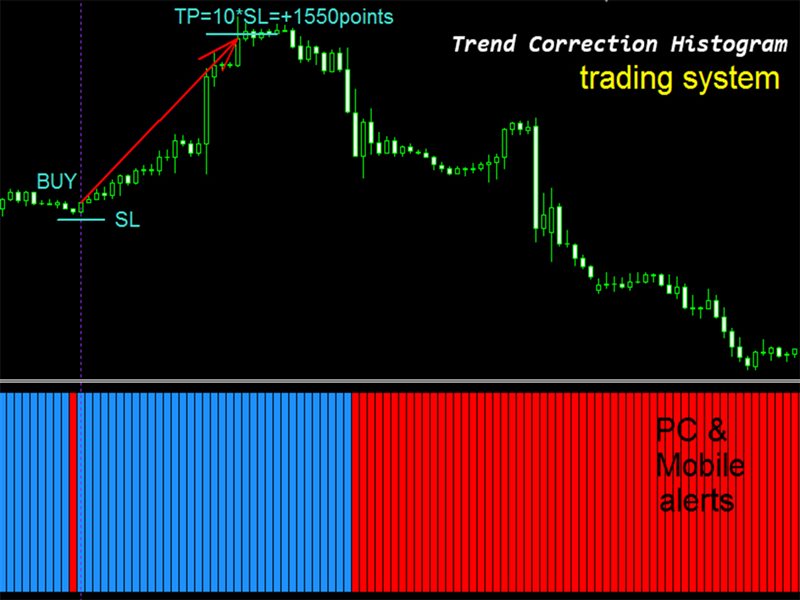
1) Check for at least 7 consecutive histogram columns of the same color, it means beginning of new trend. For example, there are more than 7 blue columns on the picture below.
2)Wait for just 1 (ONE) opposite color column, red in our case, which is changed again to blue one right after it. It means that it was trend correction.
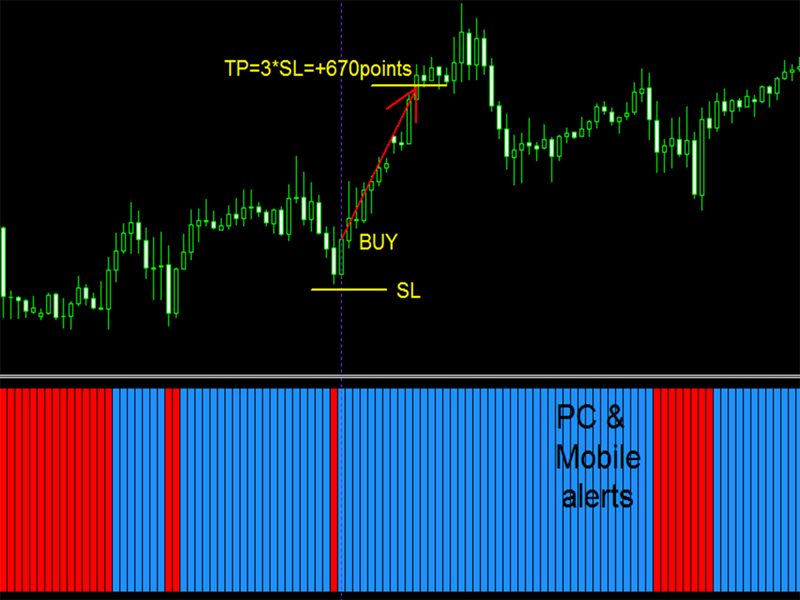
3) Open Long trade when blue column take place, after just one red column before. It means that order was opened to the direction of main trend after correction.
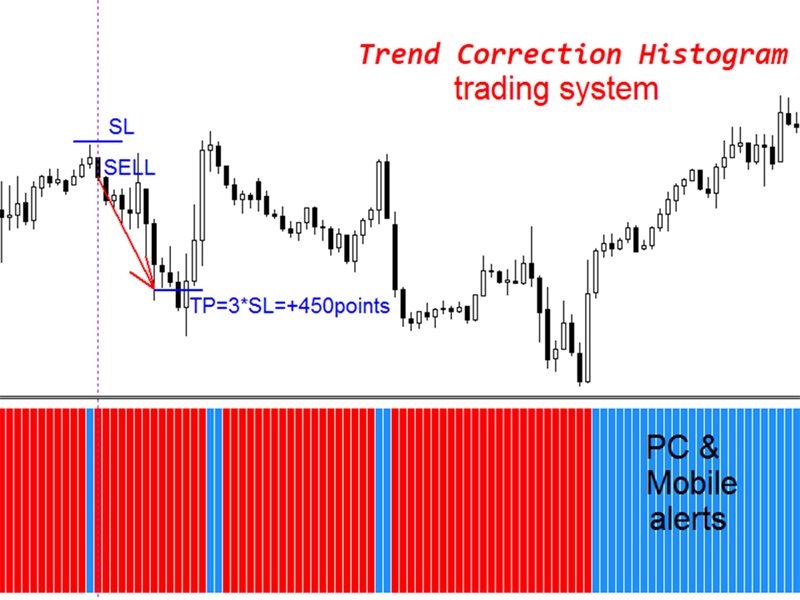
4) Arrange SL (see pictures) and TP. TP should be at least 3 times bigger than SL. In this case you will be profitable even if you win only 30%.
5) Vice versa for Sell (short) trades (see pictures).
// Great Trading Robots and Indicators are available here: https://www.mql5.com/en/users/def1380/seller
It is original product which is offered only on this MQL5 website.
