PZ Tick Chart
- Indicators
- PZ TRADING SLU
- Version: 2.0
- Updated: 10 August 2019
- Activations: 20
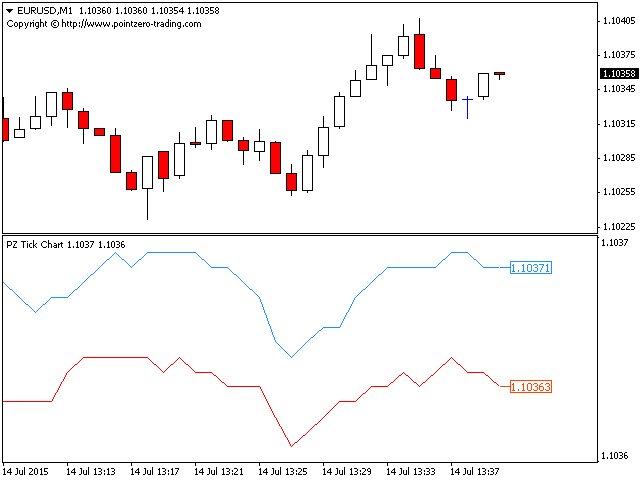
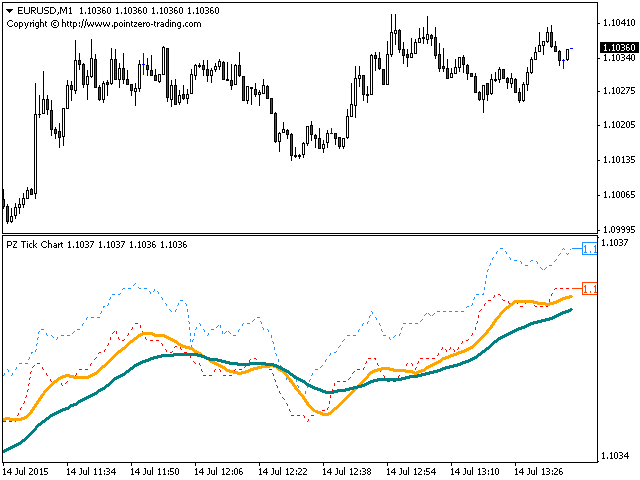
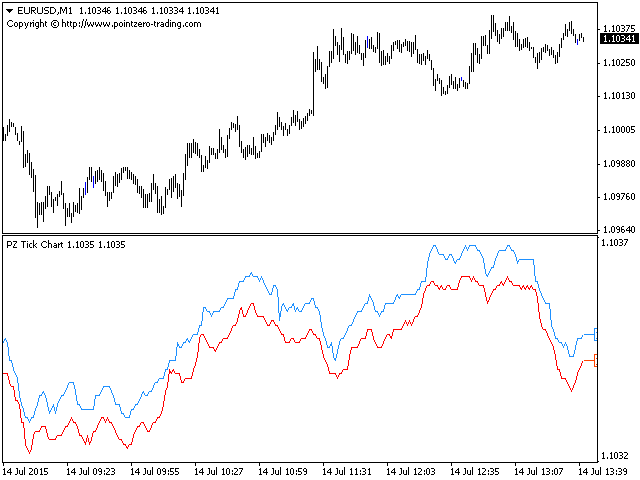
This indicator displays a complete tick chart with two optional moving averages, and makes paying attention to sub-m1 price data really easy.
[ Installation Guide | Update Guide | Troubleshooting | FAQ | All Products ]
- Identify price spikes easily
- The blue line is the ask price
- The red line is the bid price
- The indicator doesn't lose tick data when reloaded
- It implements two optional moving averages
- The indicator is non-repainting
Input Parameters
- Display Moving Averages: Display or hide the moving averages of the tick chart.
- Fast MA Period: Fast moving average period for the tick chart
- Fast MA Method: Method for the fast moving average
- Slow MA Period: Slow moving average period for the tick chart
- Slow MA Method: Slow moving average period for the tick chart
Author
Arturo López Pérez, private investor and speculator, software engineer and founder of Point Zero Trading Solutions.


User didn't leave any comment to the rating