Auto Anchored VWAPs
- Indicators
- Francisco Gomes Da Silva
- Version: 1.4
- Updated: 13 November 2023
- Activations: 20
Unveil Trading Insights with Auto Anchored VWAPs:
Auto Anchored VWAPs serve as your guiding companion in the world of trading. These indicators pinpoint crucial market turning points and illustrate them on your chart using VWAP lines. This is a game-changer for traders who employ anchored VWAP strategies.
How Does It Work?
Identifying High Points:
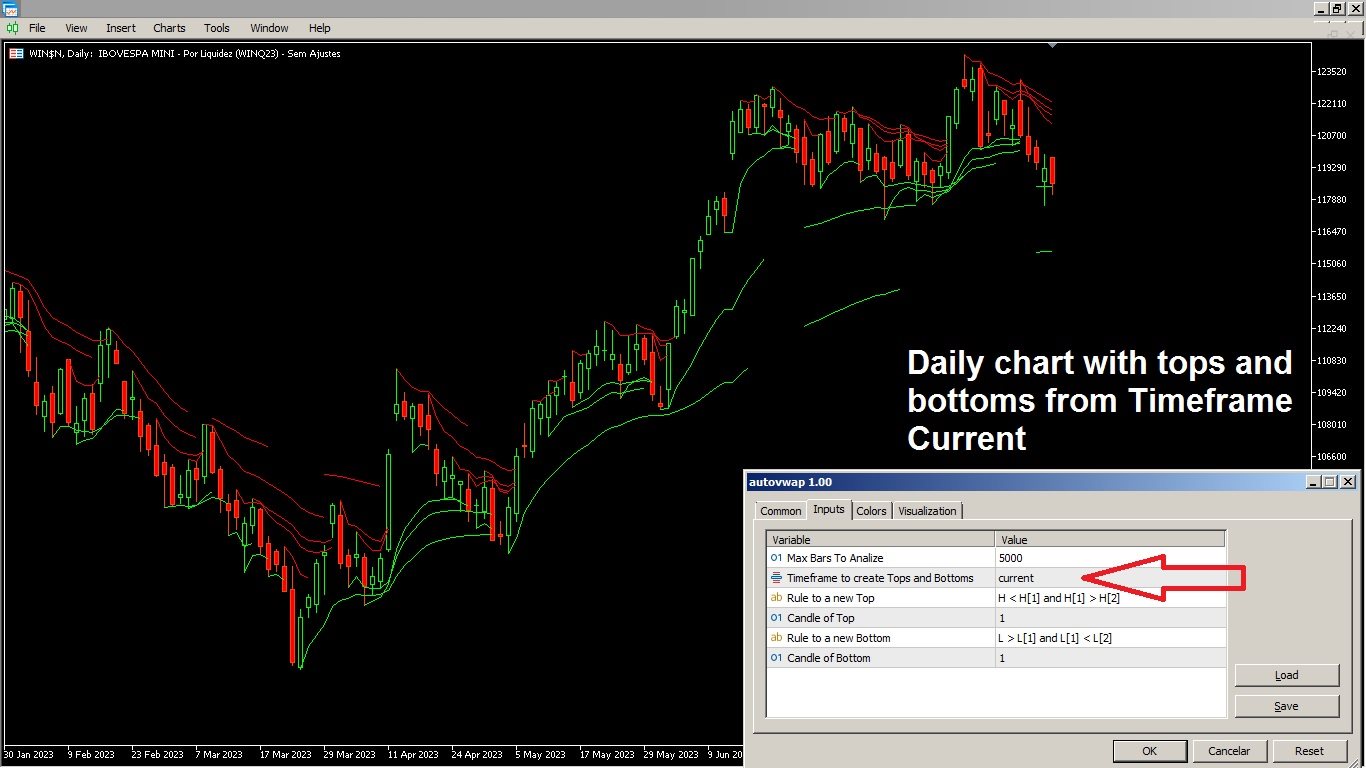
- If the highest price of the current candle is lower than the highest price of the previous one,
- And the previous high is higher than the one before it,
- We've identified a peak.
This significant point is positioned in the middle of these three candles.
Recognizing Low Points:
- If the lowest price of the current candle is higher than the lowest price of the previous one,
- And the previous low is lower than the one before it,
- We've discovered a bottom.
The focal point of this bottom is its middle.
Plotting the Anchored VWAPs:
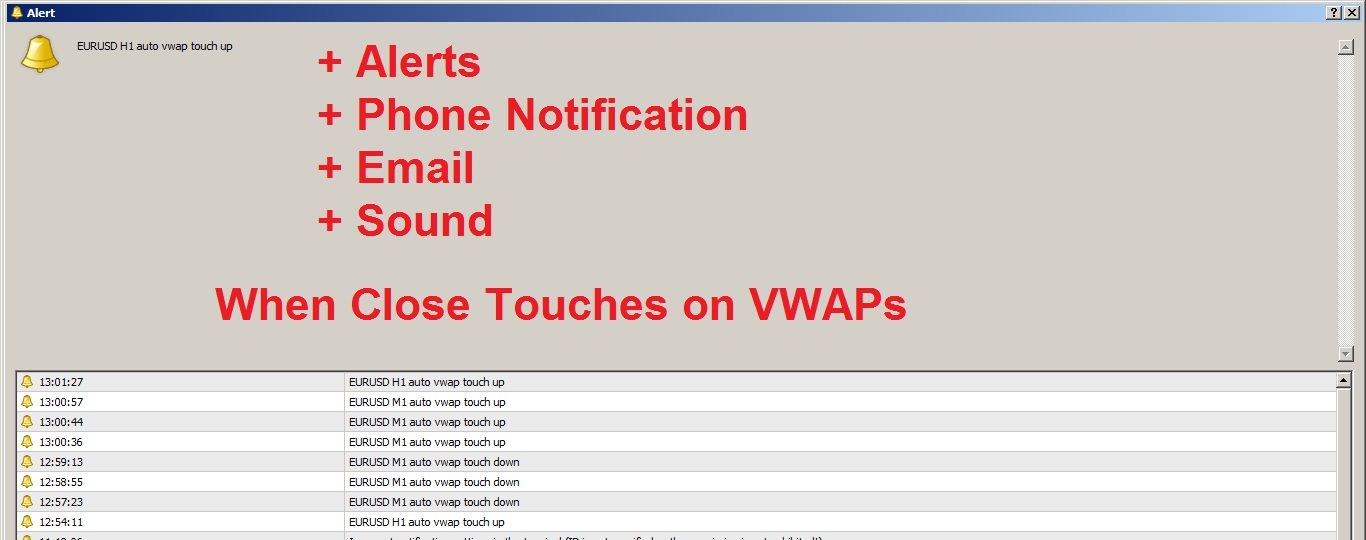
Each top and bottom corresponds to a VWAP line. However, there's a limitation: Due to the indicator's computational demands, it can display only 8 lines on the chart simultaneously.
As additional lines emerge, the older ones step aside to make room for the newer ones. If a new anchored VWAP line closes, it reopens the path for the older anchored VWAP once again.
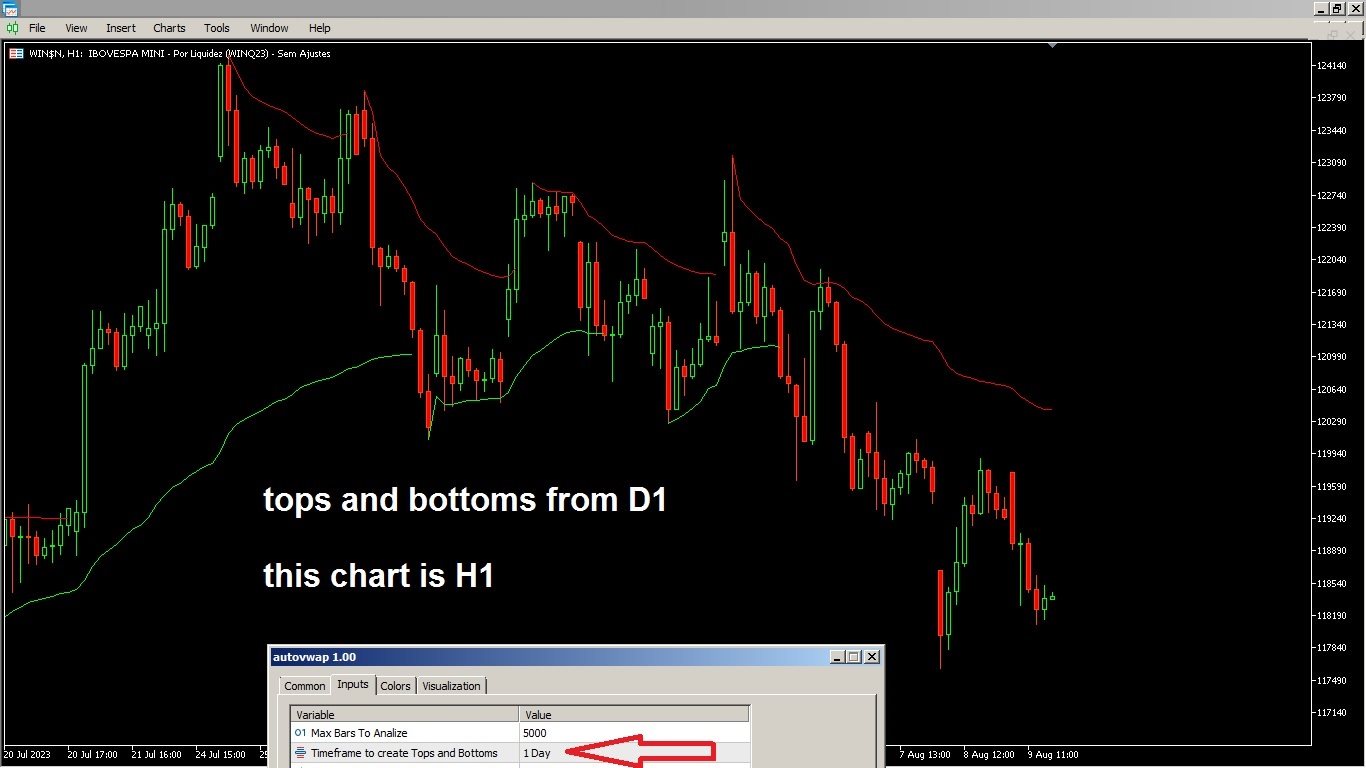
You're in command! Adjust the 'Timeframe' setting according to your pace. Keep in mind to wait for the candle of your chosen timeframe to close before confirming a peak or dip. It takes three candles to spot them, and we direct your attention to the middle one.
For smoother trading, stick to the 'Timeframe Current' setting. If you prefer historical analysis, choose a 'Higher Timeframe' and synchronize your chart's timing.
Extra Tip: Customize the number of bars to analyze. Fewer bars translate to quicker calculations. If your chart doesn't require an abundance of candles, reduce it—perhaps to 100—and witness the indicator's increased speed!
Ready to get started? Experiment with this indicator using your MetaTrader strategy tester. Play around with various timeframes to witness its magic. If it enhances your trading strategy, consider acquiring it.
Thank you for exploring this resource! Stay updated on my latest insights by following me!
Download the Auto Anchored VWAPs Indicator Version for MetaTrader 4