• Overview
  • Reviews
  • Comments

Trend Renewal Indicator

1. GENERAL DESCRIPTION OF THE TREND RENEWAL INDICATOR

The Trend Renewal Indicator (TRI) is a simple yet very powerful trend-following indicator that works on the MT5 trading platform of MetaQoutes (MLQ5).

The TRI indicator suits small and large accounts, and is ideal for very large accounts. It has been used for decades by fund managers and institutional traders, but never offered to retail traders.

The TRI works with any instrument, including currencies, crypto currencies, metals, hard and soft commodities as well as indices.

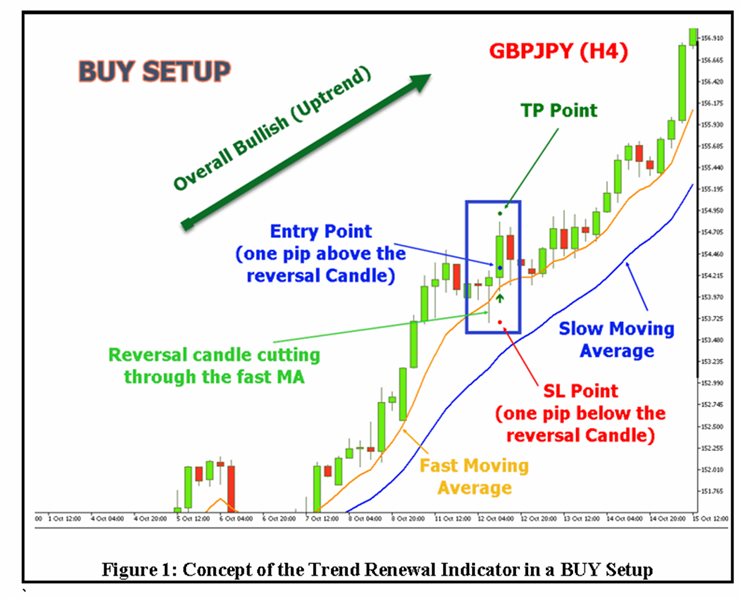
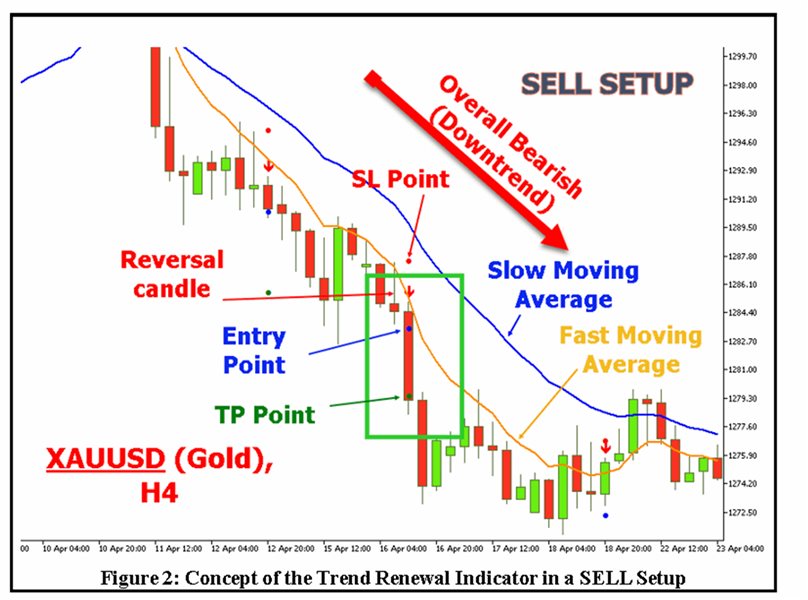
The Trend Renewal Indicator combines two trending moving averages and a strong reversal candle to generate a trade signal that marks the continuation of the original trend after a brief retracement. An example for a BUY setup is shown in Figure 1, and a similar example for a SELL setup is shown in Figure 2. Executing a trade after a triggered signal requires further consideration as discussed later; the purpose is to apply the necessary discretion that accounts for possible news announcement and zones of support and resistance. 

The TRI can be attached to H1, H4 and D1 charts, but it is ideal for the longer timeframes H4 and D1. In particular, a trading signal on the D1 chart is extremely powerful, and it can produce high profitability rates. 

The TRI does no trade too often, but when the signal appears it will have very high probability of success. Ideally, the trader can attach the TRI to all the charts you wish to trade and wait for the signal. The trader can also activate the email alert and push notification to receive the signals as they appear.

2. CONDITIONS FOR THE ENTRY SIGNAL

2.1 Buy Setup

An entry signal appears in the form of an upward arrow when 2 conditions are fulfilled: (1) the fast moving average is above the slow moving average, (2) a reversal candle is formed after a brief pullback of the price towards the 2 moving averages (see Figure 1). To qualify, the reversal candle must penetrate the fast moving average and its head (body) should be small compared with the total length of the candle in terms of a ratio to be specified by the user. 

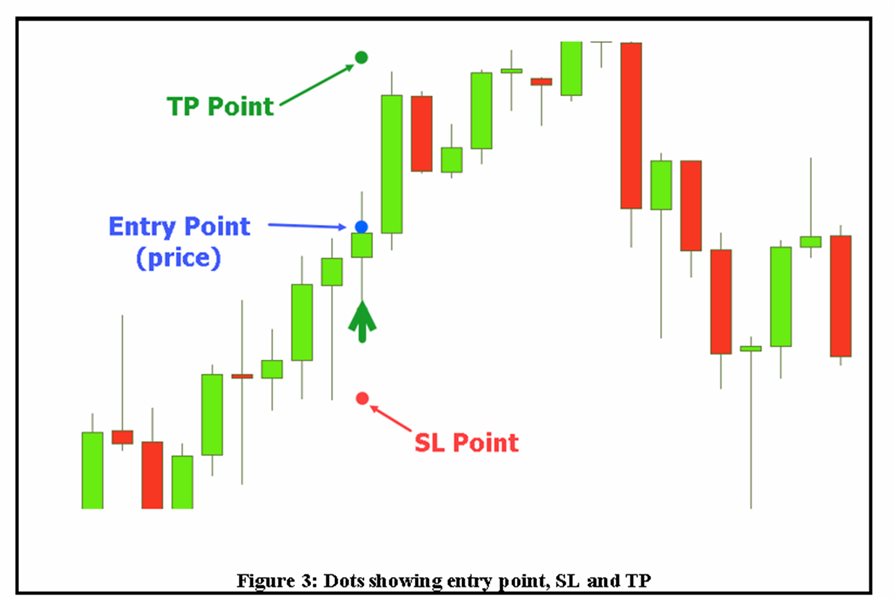
The triggered signal will draw 3 dots on the new candle that will form after the reversal candle (see Figure 3). The first dot will represent the entry price for a limit order (BUY stop) at a price above the top of the reversal candle. The second dot will represent the stop loss (SL) price, which will be located just below the reversal candle. The third dot will determine the take profit (TP) price level based on the reward to risk ratio specified by the user. The user MUST analyse the signal before execution as detailed later.  

2.2 Sell Setup

An entry signal appears in the form of a downward arrow when 2 conditions are fulfilled: (1) the fast moving average is below the slow moving average, (2) when a reversal candle is formed after a brief pullback of the price towards the 2 moving averages (see Figure 2). To qualify, the reversal candle must penetrate the fast moving average and its “inverted” head (body) should be small compared with the total length of the candle in terms of a ratio to be specified by the user. 

The triggered signal will draw 3 dots on the new candle that will form after the reversal candle. The first dot will represent the entry price for a limit order (SELL stop) at a price below the bottom of the reversal candle. The second dot will represent the stop loss (SL) price, which will be located just above the reversal candle. The third dot will determine the take profit (TP) price level based on the reward to risk ratio specified by the user. The user must analyse the signal before execution as detailed later.

SETTINGS

Points for Entry: Number of points (pips/10) above the previous candle to enter BUY or below the previous candle to enter SELL

SL (points):  Number of points (pips/10) below the previous candle to Stop Loss in a BUY or above the previous candle to Stop Loss in a SELL

Fast MA: Period, Type, Type of Price

Slow MA:  Period, Type, Type of Price


3. HOW TO USE THE TRI INDICATOR TO EXECUTE TRADES

The trader should be aware of four main factors before executing the signal to increase the probability of success:

1. The trader must confirm that the price is indeed trending prior to the current setup. This is covered in Section ‎3.1.

2. The trader must ensure that signals triggered on a small time frame such as H1 must align with higher time frames such as H4 and D1. More on that in Section ‎3.3.

3. The trader must examine the support and resistance levels near the current price. This is explained in Section ‎3.4.

4. The trader must check any pending news associated with the intended instrument. In this regard, depending on the type of impact the news has, the trader may choose to avoid trading a few hours prior to or after the news announcement. In the case of unscheduled news, the trader will need to manage the trade objectively. 

3.1 Confirmation of an established trend before the signal

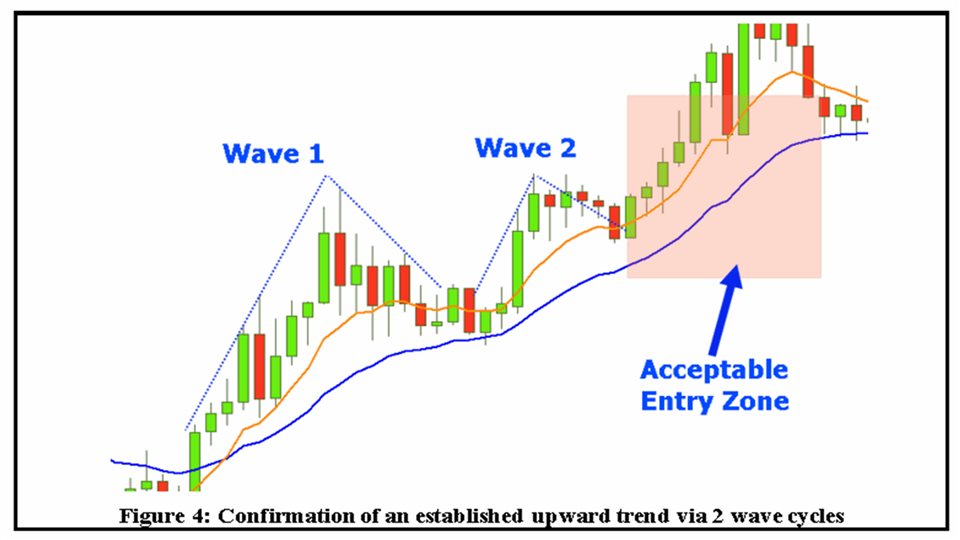
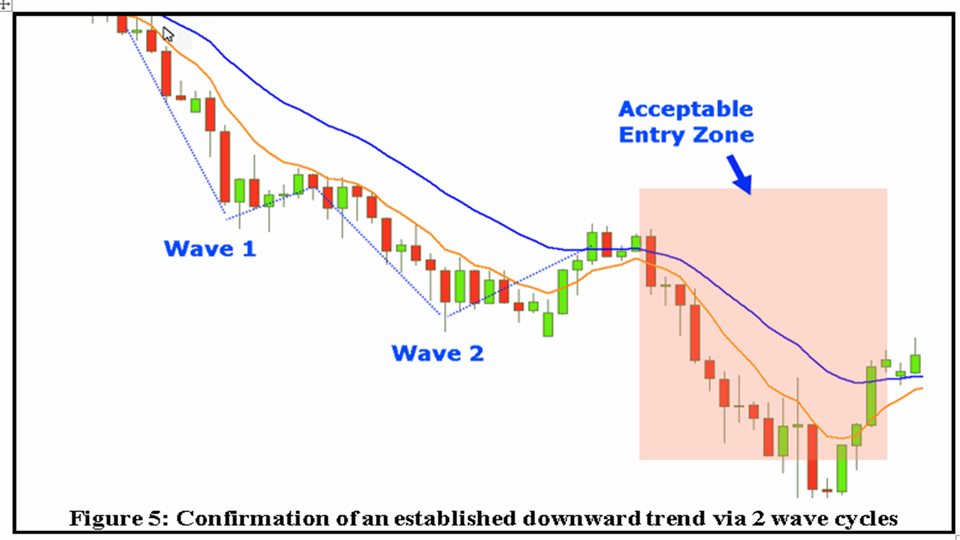
As indicated earlier, an entry signal MUST NOT be executed until further analysis is made, including confirmation that a trend had already been established prior to the current price structure without much stagnation (i.e., avoid long sideway periods). Since price moves in waves, it is recommended that 2 waves at least must have been formed before entering on the third wave. BUY and SELL examples are presented in Figure 4 and Figure 5, respectively. 

3.2 Avoidance of stagnated periods

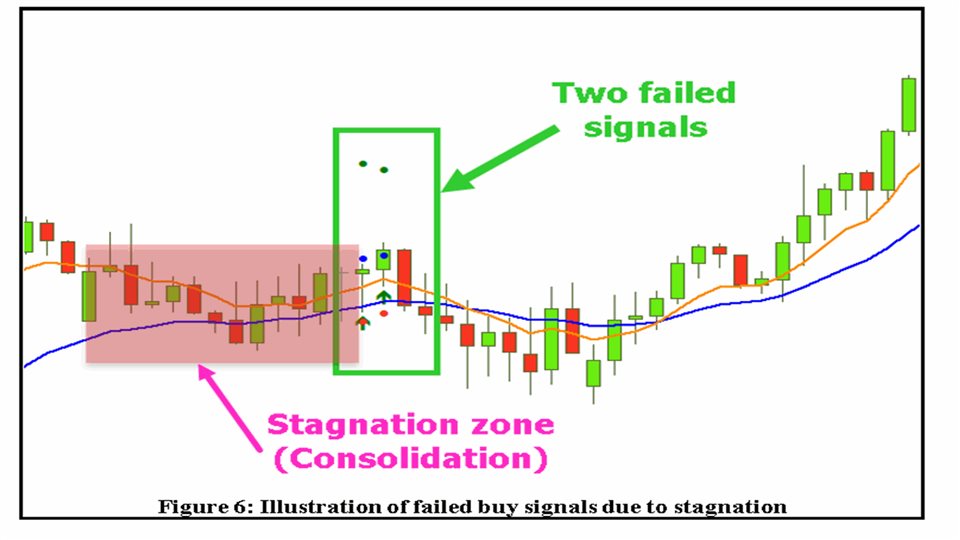
Price consolidation over a long period may denote overall trend reversal. For this reason, it is advisable to avoid entry when the price lurks for long within a price zone. In other words, the trader must see a reasonable angle between the slow and fast moving averages before executing the signal.  An example of failed signals due to stagnation is shown in Figure 6.

3.3 Alignment of small Timeframe with Higher Timeframe

As discussed earlier, the TRI can trade H1, H4 and D1 time frames. It is strongly advised that in trading H1, the overall trend of the H1 chart must align with the trend of both H4 and D1. Moving averages can be used to ascertain this requirement, such that the fast MA is above the slow MA for H1, H4 and D1 for BUY entry and the fast MA is below the slow MAs for H1, H4 and D1 for SELL entry.

This also applies to trading H4 charts where the trend must align with the D1 trend. 

3.4 Consideration of support and resistance

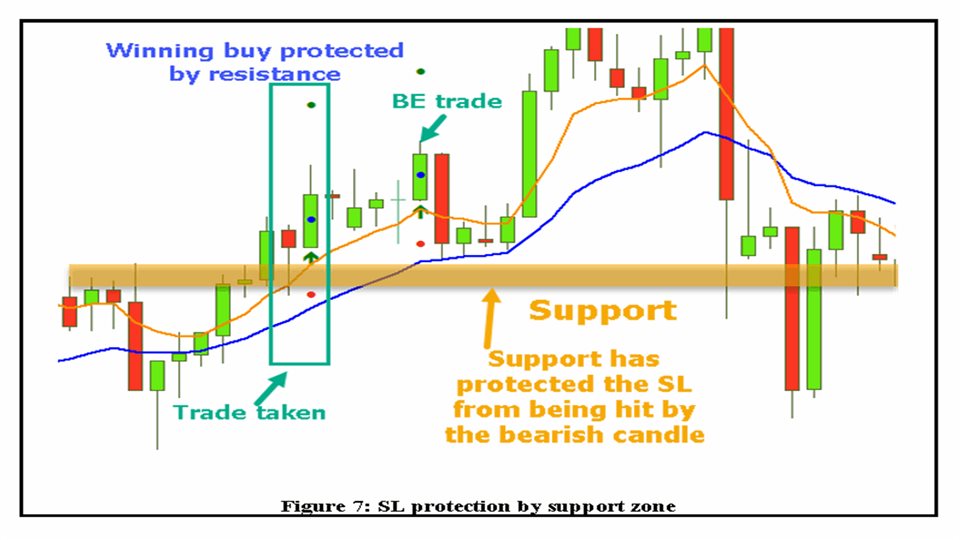
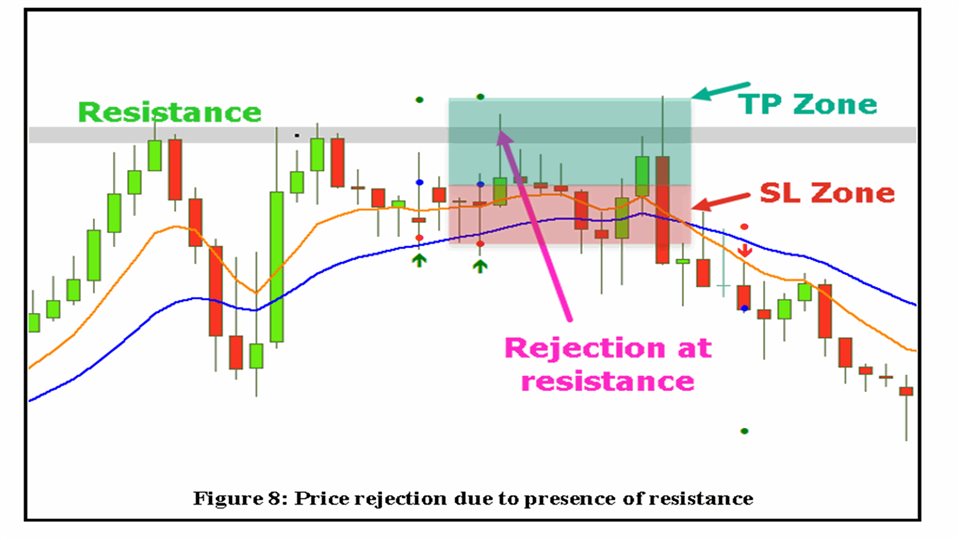
The two zones of price within the 3 dots that denote the entry, SL and TP are generally sensitive to nearby support and resistance levels (the two zones are marked in Figure 8). This effect can be summarized as follows:

BUY Signals

The presence of a strong support zone within the SL zone may be positive for the trade when the price moves downward (see Figure 7).

The presence of a strong resistance zone within the TP zone may be negative for the trade, since it may cause rejection of the uptrend movement (Figure 8).

SELL Signals

The presence of a strong resistance zone within the SL zone may be positive for the trade when the price moves upward.

The presence of a strong support zone within the TP zone may be negative for the trade, since it may cause rejection of the downtrend movement.

Note that entering or rejecting a trade may depend on the exact location of the support and resistance zones with respect to the trade SL and TP by managing the trade (partial closure etc.). 

4. PARAMETERS OF THE TRI INDICATOR

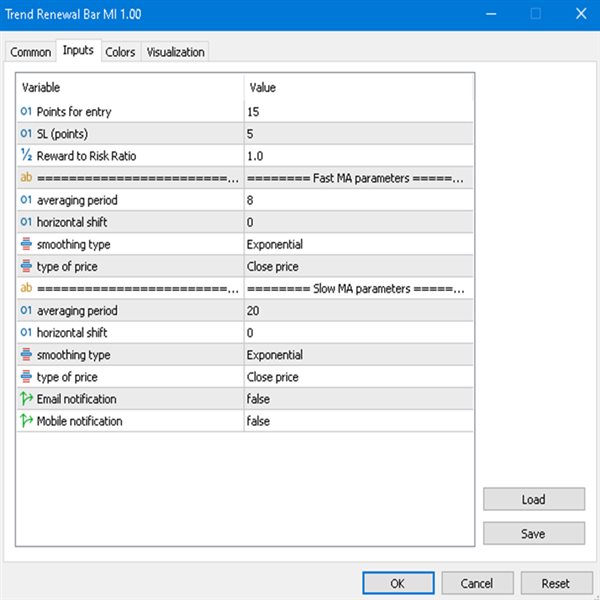
A screenshot of the various parameters used with the indicator is shown in Figure 9. Note that only a small number of parameters is needed.

Points of Entry (in points): How far the entry price is from the top of the reversal candle for BUY or from the bottom of the reversal candle for SELL

SL points: How far the entry price is from the bottom of the reversal candle for BUY, or from the top of the reversal candle for SELL

Reward to Risk Ratio: The ratio of the TP to SL from the entry price

Fast MA Period: Period used for the fast exponential moving average

Slow MA Period: Period used for the slow exponential moving average

Reversal Candle Head Ratio: Relative size of the head of the reversal candle to the total length of the candle

Email Alert: Option to receive notification via email

Push Notification: Option to receive notification via mobiles

The optimum set of parameters is provided with purchase of the indicator.

5. IMPORTANT TIPS 

As shown in Figure 10, formation of a wick before hitting the entry price increases the probability of success of the trade: the longer the wick, the better the results. Note how the bearish candle formed a top wick before reversing to hit the entry point towards a full TP in this example.

A long wick of the reversal candle add strength to the signal. See the comparison in Figure 11. The minimum length of the reversal candle can be used as an additional criterion to enter a trade using the standard average true indicator (ATR).

Generally, risk and money management must be applied during trading. It is recommended to limit the maximum risk to 3% per trade when using the TRI.

Securing partial profits is highly recommended as part of trade management. Implementing a Breakeven SL may also be needed when the price moves in the favorable direction.

Opening a new trade close to rollover time is not recommended due to erratic movement of prices around this time.

Managing an open trade around rollover time may be critical, since erratic movement of the price may hit the SL. Temporary shift of the SL during rollover can provide a solution to this issue.

Trading highly volatile pairs such as gold and digital currencies is not recommended using the smaller timeframe of H1 due to the characteristic big moves of these pairs. Back and forward testing has shown that the D1 timeframe produces excellent results in comparison.

Recommended products
Follow The Line MT5
Oliver Gideon Amofa Appiah
4.52 (29)
This indicator obeys the popular maxim that: "THE TREND IS YOUR FRIEND" It paints a GREEN line for BUY and also paints a RED line for SELL. (you can change the colors). It gives alarms and alerts of all kinds. IT DOES NOT REPAINT and can be used for all currency pairs and timeframes. Yes, as easy and simple as that. Even a newbie can use it to make great and reliable trades. NB: For best results, get my other premium indicators for more powerful and reliable signals. Get them here: https://www.m
FREE
Donchian Channel DC is the indicator of Donchian Channels, that plots maximum and minimum values of a specific period, besides mean value line. It´s possible to configure simple period for analysis and the indicator will plot all three values. You can trade with this indicator as trend or reversal, according to each strategy. Do not let to test others indicators as soon as others expert advisors.
What is this indicator? This indicator is the MACD (Moving Average Convergence/Divergence) supporting Virtual Trading mode of  Knots Compositor . When the mode is turned on, the indicator will be recalculated based on the displayed candlesticks. When the mode is turned off, the indicator will be recalculated based on the original chart candlesticks. Types of the applied price - Close - Open - High - Low - Median Price (HL/2) - Typical Price (HLC/3) - Weighted Price (HLCC/4) KC-Indicators
FREE
Half ma
Artem Svistunov
The Half ma arrow indicator for the MetaTrader 5 trading terminal is a simple but effective tool that gives a signal about a change in the current trend. The Half ma indicator looks like a solid dynamic line that changes color at the points where the trend changes. At these points, the indicator draws arrows of the corresponding color and direction.The Half ma arrow indicator for the MT5 terminal is not an independent source of input signals. It will be most effective to use it as a trend filte
DALA Forecast
Grigorii Matsnev
About the indicator: DALA Forecast is a universal tool for predicting the dynamics of time series of any nature. For prediction, modified methods of nonlinear dynamics analysis are used, on the basis of which a predictive model is built using machine learning methods.  To get the trial version of the indicator, you can contact me in private messages. How to use the indicator: Apply the indicator to your chosen financial instrument or indicator with the settings you need. The prediction will b
FREE
Enhance your trading analysis with the Haiken Ashi MT5 indicator. This powerful tool transforms standard price data into smoother, trend-following candlesticks, making it easier to identify market trends and potential reversal points.    Key Features: Clear Trend Identification: Visually distinguish between uptrends and downtrends with distinct candle colors. Reduced Noise: Filter out price fluctuations, providing a clearer view of underlying market movements. Early Trend Detection: Anticipate
FREE
LT Donchian Channel
Thiago Duarte
4.83 (6)
Donchian Channel is an indicator created by Richard Donchian. It is formed by taking the highest high and the lowest low of the last specified period in candles. The area between high and low is the channel for the chosen period. Its configuration is simple. It is possible to have the average between the upper and lower lines, plus you have alerts when price hits one side. If you have any questions or find any bugs, please contact me. Enjoy!
FREE
Important Lines
Terence Gronowski
4.86 (21)
This indicator displays Pivot-Lines, preday high and low, preday close and the minimum and maximum of the previous hour. You just have to put this single indicator to the chart to have all these important lines, no need to setup many single indicators. Why certain lines are important Preday high and low : These are watched by traders who trade in a daily chart. Very often, if price climbs over or falls under a preday low/high there is an acceleration in buying/selling. It is a breakout out of
FREE
Mitimom
Danil Poletavkin
The indicator is based on Robert Miner's methodology described in his book "High probability trading strategies" and displays signals along with momentum of 2 timeframes. A Stochastic oscillator is used as a momentum indicator. The settings speak for themselves period_1 is the current timeframe, 'current' period_2 is indicated - the senior timeframe is 4 or 5 times larger than the current one. For example, if the current one is 5 minutes, then the older one will be 20 minutes The rest of the
FREE
Free automatic Fibonacci is an indicator that automatically plots a Fibonacci retracement based on the number of bars you select on the BarsToScan setting in the indicator. The Fibonacci is automatically updated in real time as new highest and lowest values appears amongst the selected bars. You can select which level values to be displayed in the indicator settings. You can also select the color of the levels thus enabling the trader to be able to attach the indicator several times with differe
FREE
Automatic Trendlines
Pasi Hakamaki
4.64 (42)
The indicator draws trendlines on chart. This indicator has six inputs. User can specify alternative labels for both lines. If multiple instances of the indicator are used, the labels must differ. User can set width and color of the lines and depth which specifies what significant peaks should be used. For example, Depth=10 sets trendlines using the current peaks and valleys that have at least 10 bars to the right and to the left and that have highs/lows less/greater than the peak's high/low. In
FREE
This indicator is a zero-lag indicator and displays  strength of trend change . True Trend  Oscillator Pro works best in combination with True Trend Moving Average Pro that displays exact trend as is. Oscillator value is exact price change in given direction of the trend. True Trend Moving Average Pro: https://www.mql5.com/en/market/product/103586 If you set PERIOD input parameter to 1 this indicator becomes a sharpshooter for binary options. Developers can use True Trend Oscillator in E
FREE
The indicator identifies when a divergence occurs between price and an indicator or oscillator. It identifies both regular and hidden divergences. Combined with your own rules and techniques, this indicator will allow you to create (or enhance) your own powerful system. Features Can detect divergences for the following oscillators/indicators:   MACD, OsMA, Stochastics, RSI, CCI, RVI, Awesome, ADX, ATR, OBV, Composite index, MFI and Momentum. Only one oscillator/indicator can be selected. Draws
FREE
The indicator highlights the points that a professional trader sees in ordinary indicators. VisualVol visually displays different volatility indicators on a single scale and a common align. Highlights the excess of volume indicators in color. At the same time, Tick and Real Volume, Actual range, ATR, candle size and return (open-close difference) can be displayed. Thanks to VisualVol, you will see the market periods and the right time for different trading operations. This version is intended f
FREE
Are you tired of drawing trendlines every time you're analyzing charts? Or perhaps you would like more consistency in your technical analysis. Then this is for you. This indicator will draw trend lines automatically when dropped on a chart. How it works Works similar to standard deviation channel found on mt4 and mt5. It has 2 parameters: 1. Starting Bar 2. Number of bars for calculation The   starting bar   is the bar which drawing of the trend lines will begin, while the   number of bars for c
FREE
This innovative indicator for measuring the strength of currencies from INFINITY is an indispensable assistant for scalpers and traders trading for a long time. The system for analyzing the Strength / weakness of currencies has long been known and used in the market by the world's leading traders. Any arbitrage trading is not complete without this analysis. Our indicator easily determines the strength of the base currencies in relation to each other. It displays line charts for all or the curre
FREE
This is Gekko's Cutomized Cutomized Average Directional Index (ADX), a customized version of the famous ADX indicator. Use the regular ADX and take advantage two entry signals calculations and different ways of being alerted whenever there is potential entry or exit point. Inputs Period: Period for the ADX calculation; PlotSignalType: How will the indicator calculate entry (swing) signals: 1- ShowSwingsOnTrendLevel : Show Signals for Trend Confirmation Swings; 2- ShowSwingsOnTrendLevelDirectio
The Trend Catcher: The Trend Catcher Strategy with Alert Indicator is a versatile technical analysis tool that aids traders in identifying market trends and potential entry and exit points. It features a dynamic Trend Catcher Strategy , adapting to market conditions for a clear visual representation of trend direction. Traders can customize parameters to align with their preferences and risk tolerance. The indicator assists in trend identification, signals potential reversals, serves as a trail
FREE
Coral Indi
Dinh Duong Luong
Coral trend is   a trend-following indicator that is widely popular among FOREX traders . It is usually used as a confluence with other indicators. It uses combinations of moving averages with complex smoothing formulas! It has two configurable parameters: Coefficient   - smoothing ratio (*) Applied price Calculation: Coral = (-0.064) * B6 + 0.672 * B5 - 2.352 * B4 + 2.744 * B3
FREE
A new generation progressive indicator from INFINITY. Predictor PRO uses its own entry and exit calculation strategy. Indicator without redrawing signals! This is very important for real trading. The indicator can be used for any currency pairs, metals, cryptocurrencies or indices. The best time of the H1 chart. Unlike other indicators, Predictor PRO shows shows the Buy/Sell entry point and the Close exit point. Calculating the profit of all signals in points on the panel helps to choose th
FREE
Cumulative Delta MT5
Evgeny Shevtsov
4.54 (54)
The indicator analyzes the volume scale and splits it into two components - seller volumes and buyer volumes, and also calculates the delta and cumulative delta. The indicator does not flicker or redraw, its calculation and plotting are performed fairly quickly, while using the data from the smaller (relative to the current) periods. The indicator operation modes can be switched using the Mode input variable: Buy - display only the buyer volumes. Sell - display only the seller volumes. BuySell -
FREE
This indicator is especially for the binary trading. Time frame is 1 minutes and exp time 5 or 3 minutes only. You must be use martingale 3 step. So you must put lots size is 10 % at most. You should use Mt2 trading platform to connect with my indicator to get more signal without human working. This indicator wining rate is over 80% but you may get 100% of profit by using martingale 3 step. You should use MT2 Trading Platform to connect meta trader platform and binary platform . You can get mt2
FREE
The indicator detects and displays М. Gartley's Butterfly pattern. The pattern is plotted by the extreme values of the ZigZag indicator (included in the resources, no need to install). After detecting the pattern, the indicator notifies of that by the pop-up window, a mobile notification and an email. The pattern and wave parameters are displayed on the screenshots. The default parameters are used for demonstration purposes only in order to increase the amount of detected patterns. Parameters
Best SAR MT5
Ashkan Hazegh Nikrou
5 (2)
Description :  we are happy to introduce our new free indicator based on one of professional and popular indicators in forex market (Parabolic SAR) this indicator is new modification on original Parabolic SAR indicator, in pro SAR indicator you can see cross over between dots and price chart, this crossover is not signal but talk about end of movement potential, you can start buy by new blue dot, and place stop loss one atr before first blue dot, and finally you can exit as soon as dots cross
FREE
Value Chart Candlesticks
Flavio Javier Jarabeck
4.73 (11)
The idea of a Value Chart indicator was presented in the very good book I read back in 2020 , " Dynamic Trading Indicators: Winning with Value Charts and Price Action Profile ", from the authors Mark Helweg and David Stendahl. The idea is simple and the result is pure genius: Present candlestick Price analysis in a detrended way! HOW TO READ THIS INDICATOR Look for Overbought and Oversold levels. Of course, you will need to test the settings a lot to find the "correct" one for your approach.
FREE
BoxInside MT5
Evgeny Shevtsov
5 (4)
This indicator calculates the volume profile and places labels that correspond to the VAH, VAL and POC levels, for each candle individually. Indicator operation features The indicator works on the timeframes from M3 to MN, but it uses the history data of smaller periods: M1 - for periods from M3 to H1, M5 - for periods from H2 to H12, M30 - for the D1 period, H4 - for the W1 period, D1 - for the MN period. The color and location of the VAL, VAH and POC labels on the current candle are consider
FREE
Renko Chart
Marcin Konieczny
3.63 (8)
This indicator allows to display Renko charts in the indicator window. Renko charts show only price movements that are bigger than the specified box size. It helps to eliminate noise and allows to focus on main trends. Time is not a factor here. Only price movements are taken into account. That's why Renko chart is not synchronized with the main chart it is attached to. Indicator works in two modes: CLOSE - only close prices are taken into account while building the chart HIGH_LOW - only high/
FREE
Introduction This indicator detects volume spread patterns for buy and sell opportunity. The patterns include demand and supply patterns. You might use each pattern for trading. However, these patterns are best used to detect the demand zone (=accumulation area) and supply zone (=distribution area). Demand pattern indicates generally potential buying opportunity. Supply pattern indicates generally potential selling opportunity. These are the underlying patterns rather than direct price action. T
FREE
HMA Color with Alerts MT5
Pavel Zamoshnikov
4.72 (50)
Hull Moving Average (HMA) is well-deservedly popular among traders because of the effective averaging of market noise and a relatively small delay. The current MetaTrader 5 version changes its color when the movement direction changes. Sound and text signals are available. It also supports sending email and push messages. It is possible to trigger a signal on the current incomplete bar, although such a signal may be canceled before completion if conditions are no longer appropriate. One of the p
FREE
Order Book, known also as Market Book, market depth, Level 2, - is a dynamically updated table with current volumes of orders to buy and to sell specific financial instument at price levels near Bid and Ask. MetaTrader 5 provides the means for receiving market book from your broker, but in real time only, without access to its history. The indicator OrderBook Cumulative Indicator accumulates market book data online and visualizes them on the chart. In addition, the indicator can show the market
Buyers of this product also purchase
TPSproTREND PrO MT5
Roman Podpora
4.54 (13)
TPSpro TREND PRO  - is a trend indicator that automatically analyzes the market and provides information about the trend and each of its changes, as well as giving signals for entering trades without redrawing! The indicator uses each candle, analyzing them separately. referring to different impulses - up or down impulse. Exact entry points into transactions for currencies, crypto, metals, stocks, indices!  INSTRUCTIONS     RUS   -    ENG              R ecommended to use with an indicator   - 
How many times have you bought a trading indicator with great back-tests, live account performance proof with fantastic numbers and stats all over the place but after using it, you end up blowing your account? You shouldn't trust a signal by itself, you need to know why it appeared in the first place, and that's what RelicusRoad Pro does best! User Manual + Strategies + Training Videos + Private Group with VIP Access + Mobile Version Available A New Way To Look At The Market RelicusRoad is
TPSpro RFI Levels MT5
Roman Podpora
4.67 (15)
A key element in trading is zones or levels from which decisions to buy or sell a trading instrument are made. Despite attempts by major players to conceal their presence in the market, they inevitably leave traces. Our task was to learn how to identify these traces and interpret them correctly. INSTRUCTIONS    RUS   -    ENG           R ecommended to use with an indicator   -   TPSpro  TREND PRO -  Version MT4 Main functions:: Displaying active zones for sellers and buyers! The indicator show
Quantum TrendPulse
Bogdan Ion Puscasu
5 (4)
Introducing Quantum TrendPulse , the ultimate trading tool that combines the power of SuperTrend , RSI , and Stochastic into one comprehensive indicator to maximize your trading potential. Designed for traders who seek precision and efficiency, this indicator helps you identify market trends, momentum shifts, and optimal entry and exit points with confidence. Key Features: SuperTrend Integration: Easily follow the prevailing market trend and ride the wave of profitability. RSI Precision: Detect
CBT Quantum Maverick High-Efficiency Binary Trading System CBT Quantum Maverick is a finely tuned, high-performance binary options trading system designed for traders seeking precision, simplicity, and disciplined trading. No customization is required—this system is optimized for effective results right out of the box. Simply follow the signals, which can be mastered with a bit of practice. Key Features: Signal Precision: New-bar-based trading signals—targeting the next candle based on curr
Golden Trend Indicator MT5
Noha Mohamed Fathy Younes Badr
4.78 (9)
Golden Trend indicator  is The best indicator for predicting trend movement this indicator never lags and never repaints and never back paints    and give  arrow buy and sell    before the candle appear  and it will help you and  will make your trading decisions clearer its work on all currencies and  gold and crypto and all time frame This unique  indicator uses very secret algorithms to catch the  trends, so you can trade using this indicator and see the trend clear on charts  manual guide and
FX Power MT5 NG
Daniel Stein
5 (7)
Unlock the Full Power of FX Power NG: The Ultimate Currency Strength Meter For over eight years, FX Power has empowered traders worldwide with reliable, precise currency strength analysis.  Now, FX Power NG takes this trusted tool to the next level, offering advanced features that bring unmatched accuracy, customization, and insights to your trading. What Makes FX Power NG a Must-Have for Serious Traders? FX Power NG builds on everything you loved in the original FX Power, with key additions
FX Volume MT5
Daniel Stein
4.93 (14)
Gain a True Edge in Forex with FX Volume: The Ultimate Volume Indicator FX Volume is the first and only volume indicator to reveal genuine market sentiment from an insider’s perspective. By providing unique insights into how institutional market participants and brokers are positioned, FX Volume allows you to trade with the foresight usually reserved for major players. Say goodbye to the delays of COT reports—FX Volume gives you this crucial information instantly on your chart, empowering you
First of all Its worth emphasizing here that this Trading System is Non-Repainting   , Non Redrawing and Non Lagging Indicator Which makes it ideal from both manual and robot trading .  Online course, manual and download presets. The Smart Trend Trading System MT5 is a comprehensive trading solution tailored for new and experienced traders . It combines over 10 premium indicators and features more than 7 robust trading strategies , making it a versatile choice for diverse market conditions . Tre
FX Dynamic - The Only ATR Indicator You’ll Ever Need Ready to supercharge your trading strategies with unparalleled precision and insight? Meet  FX Dynamic , the first and only ATR indicator designed for  currency-based analysis  and the  automatic adjustment for brokers’ GMT shifts . Say goodbye to outdated tools and embrace the ultimate solution for mastering market volatility. Why FX Dynamic is a Game-Changer Currency-Based ATR Analysis -  Break free from traditional tools. FX Dynamic is
MetaForecast M5
Vahidreza Heidar Gholami
5 (2)
MetaForecast predicts and visualizes the future of any market using different powerful methods. While financial markets are not always predictable, if there are patterns in the past data, MetaForecast can learn and predict the future as accurately as possible. It features a complete implementation of neural networks embedded directly into the indicator, enabling traders to create and train AI models using data from multiple symbols to learn complex patterns. MetaForecast leverages your computer'
Atomic Analyst MT5
Issam Kassas
4.32 (19)
First of all Its worth emphasizing here that this Trading Indicator is   Non-Repainting   , Non Redrawing and Non Lagging Indicator   Indicator, Which makes it ideal from both manual and robot trading.  User manual: settings, inputs and strategy . The Atomic Analyst  is a PA Price Action Indicator that uses Strength and Momentum of the price to find a better edge in the market. Equipped with Advanced filters which help remove noises and false signals, and Increase Trading Potential. Using Mult
Introducing   Quantum Breakout PRO , the groundbreaking MQL5 Indicator that's transforming the way you trade Breakout Zones! Developed by a team of experienced traders with trading experience of over 13 years,   Quantum Breakout PRO   is designed to propel your trading journey to new heights with its innovative and dynamic breakout zone strategy. Quantum Breakout Indicator will give you signal arrows on breakout zones with 5 profit target zones and stop loss suggestion based on the breako
Discover FX Levels: Your Ultimate Support and Resistance Indicator for Trading Success FX Levels is more than just a support and resistance indicator; it’s a game-changer for serious traders who want precision, reliability, and seamless functionality across all trading symbols—be it currency pairs, indices, stocks, or commodities. Built on the proven Lighthouse method and enhanced with dynamic, real-time adaptability, FX Levels brings market reversal points right to your chart, perfect for set
TPA True Price Action indicator reveals the true price action of the market makers through 100% non-repainting signals strictly at the close of a candle! TPA shows entries and re-entries, every time the bulls are definitely stronger than the bears and vice versa. Not to confuse with red/green candles. The shift of power gets confirmed at the earliest stage and is ONE exit strategy of several. There are available now two free parts of the TPA User Guide for our customers. The first "The Basics"
This dashboard shows the latest available   harmonic patterns   for the selected symbols, so you will save time and be more efficient /   MT4 version . Free Indicator:   Basic Harmonic Pattern Comparison of "Basic Harmonic Pattern" vs. "Basic Harmonic Patterns Dashboard" Indicators Feature Basic Harmonic Pattern Basic Harmonic Patterns Dashboard Functionality Detects and displays harmonic patterns on a single chart Searches multiple symbols and timeframes for harmonic patterns, displays
Top indicator for MT5   providing accurate signals to enter a trade without repainting! It can be applied to any financial assets:   forex, cryptocurrencies, metals, stocks, indices .  Watch  the video  (6:22) with an example of processing only one signal that paid off the indicator! MT4 version is here It will provide pretty accurate trading signals and tell you when it's best to open a trade and close it. Most traders improve their trading results during the first trading week with the help of
IX Power MT5
Daniel Stein
4.17 (6)
Introducing IX Power – the ultimate tool to supercharge your trading precision! Designed with the same unbeatable accuracy as FX Power, IX Power lets you master any trading symbol, from indices and stocks to commodities, ETFs, and even cryptocurrencies. Get ready to elevate your trading with precise insights into short, medium, and long-term trends across all your favorite assets. Why Choose IX Power? With IX Power, your timing becomes razor-sharp, helping you make smarter, faster trading dec
Royal Wave Pro M5
Vahidreza Heidar Gholami
3.5 (4)
Royal Wave is a Trend-Power oscillator which has been programmed to locate and signal low-risk entry and exit zones. Its core algorithm statistically analyzes the market and generates trading signals for overbought, oversold and low volatile areas. By using a well-designed alerting system, this indicator makes it easier to make proper decisions regarding where to enter and where to exit trades. Features Trend-Power Algorithm Low risk Entry Zones and Exit Zones Predictions for Overbought and Over
MetaBands M5
Vahidreza Heidar Gholami
4.5 (2)
MetaBands uses powerful and unique algorithms to draw channels and detect trends so that it can provide traders with potential points for entering and exiting trades. It’s a channel indicator plus a powerful trend indicator. It includes different types of channels which can be merged to create new channels simply by using the input parameters. MetaBands uses all types of alerts to notify users about market events. Features Supports most of the channel algorithms Powerful trend detection algorith
Berma Bands
Muhammad Elbermawi
The Berma Bands (BBs) indicator is a valuable tool for traders seeking to identify and capitalize on market trends. By analyzing the relationship between the price and the BBs, traders can discern whether a market is in a trending or ranging phase. Berma Bands are composed of three distinct lines: the Upper Berma Band, the Middle Berma Band, and the Lower Berma Band. These lines are plotted around the price, creating a visual representation of the price movement relative to the overall trend.
TrendMaestro5
Stefano Frisetti
note: this indicator is for METATRADER4, if you want the version for METATRADER5 this is the link:  https://www.mql5.com/it/market/product/108106 TRENDMAESTRO ver 2.4 TRENDMAESTRO recognizes a new TREND in the bud, he never makes mistakes. The certainty of identifying a new TREND is priceless. DESCRIPTION TRENDMAESTRO identifies a new TREND in the bud, this indicator examines the volatility, volumes and momentum to identify the moment in which there is an explosion of one or more of these data a
Quantum Heiken Ashi PRO MT5
Bogdan Ion Puscasu
4.44 (9)
Introducing the Quantum Heiken Ashi PRO charts with integrated alerts Designed to provide clear insights into market trends, the Heiken Ashi candles are renowned for their ability to filter out noise and eliminate false signals. Say goodbye to confusing price fluctuations and hello to a smoother, more reliable chart representation. What makes the Quantum Heiken Ashi PRO truly unique is its innovative formula, which transforms traditional candlestick data into easy-to-read colored bars. Red and g
IVISTscalp5
Vadym Zhukovskyi
5 (6)
What's new about iVISTscalp5 forecast indicator (Version 10)? iVISTscalp5 is a unique nonlinear forecasting for a week ahead system for any financial instrument which executes fast scalping using time levels. iVISTscalp5 is a tool for easy study and understanding of financial market. 1) iVISTscalp5 forecast indicator has been completely rewritten into another programming language (C++), which has accelerated data loading and processing. As a result, a different graphical display of forecast
Market Overview MT5
Mehran Sepah Mansoor
Optimize your trading decisions with our market strength and sentiment indicator and no longer trade against the trend! Meticulously designed for serious traders who value accurate and timely information, our indicator provides a bird's-eye view of the 28 major pairs in a very simple way. This tool is able to rank the currency pairs based on terms of popularity, bullish or bearish trend strength and percentage of buyers and sellers /   MT4 version .  Features Real-Time Trend Strength: Get an
Was: $249  Now: $99   Market Profile defines a number of day types that can help the trader to determine market behaviour. A key feature is the Value Area, representing the range of price action where 70% of trading took place. Understanding the Value Area can give traders valuable insight into market direction and establish the higher odds trade. It is an excellent addition to any system you may be using. Inspired by Jim Dalton’s book “Mind Over Markets”, this indicator is designed to suit the
Trend Forecaster
Alexey Minkov
5 (6)
The Trend Forecaster indicator utilizes a unique proprietary algorithm to determine entry points for a breakout trading strategy. The indicator identifies price clusters, analyzes price movement near levels, and provides a signal when the price breaks through a level. The Trend Forecaster indicator is suitable for all financial assets, including currencies (Forex), metals, stocks, indices, and cryptocurrencies. You can also adjust the indicator to work on any time frames, although it is recommen
Quantum Trend Sniper
Bogdan Ion Puscasu
4.72 (50)
Introducing   Quantum Trend Sniper Indicator , the groundbreaking MQL5 Indicator that's transforming the way you identify and trade trend reversals! Developed by a team of experienced traders with trading experience of over 13 years,   Quantum Trend Sniper Indicator   is designed to propel your trading journey to new heights with its innovative way of identifying trend reversals with extremely high accuracy. ***Buy Quantum Trend Sniper Indicator and you could get Quantum Breakout Indicator fo
Bill Williams Advanced
Siarhei Vashchylka
5 (9)
Bill Williams Advanced is designed for automatic chart analysis using Bill Williams' "Profitunity" system. The indicator analyzes four timeframes at once. Manual (Be sure to read before purchasing) Advantages 1. Automatically analyzes the chart using the "Profitunity" system of Bill Williams. The found signals are placed in a table in the corner of the screen. 2. Equipped with a trend filter based on the Alligator indicator. Most of the system signals are recommended to be used only accordi
UR TrendExhaustion MT5   UR   TrendExhaustion  MT5 is the best solution for traders who don't want to deal with parameter values nor other set-ups - it is both easy and visually-understandable for everyone. Advantages of using UR TrendExhaustion MT5: No parameters You have 3 lines that describe best what's going on on the chart:   Trend Exhaustion Line ,   Whale Money Line   and   Retail Money Line . The interface showcases the exhaustion of either line on both extremes (red areas) The best adva
Filter:
No reviews
Reply to review