• Overview
  • Reviews
  • Comments

NAS30 Scalper

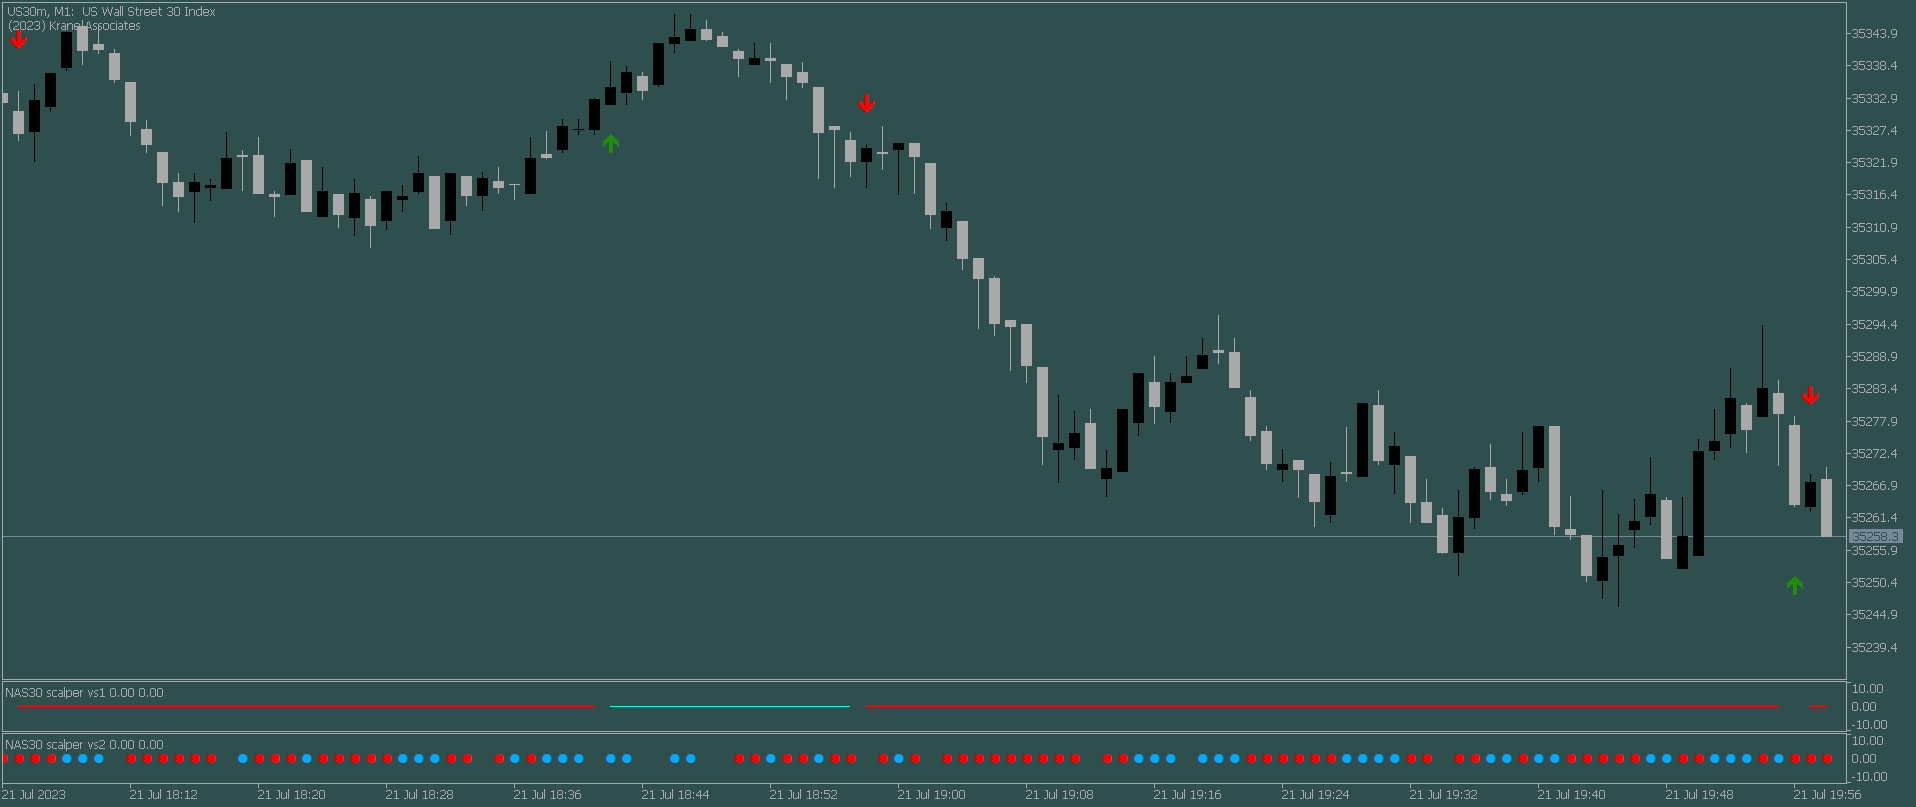
The NAS30 Scalper Indicator is a cutting-edge tool designed to provide precise buy and sell signals for scalping trading strategies on NAS100 and US30. This indicator leverages advanced algorithms to identify short-term market trends and capitalize on quick price movements, making it perfect for traders looking to seize rapid profit opportunities.

Key Features:

  1. Real-Time Signals: Receive instant alerts when the indicator detects optimal entry and exit points, ensuring you never miss a profitable trade.

  2. Scalping Optimized: Specifically tailored for scalping strategies, the Dynamic Scalper Indicator targets quick trades, maximizing your potential returns within minutes.

  3. User-Friendly Interface: The indicator boasts a user-friendly interface, allowing both novice and experienced traders to easily interpret signals and make swift decisions.

  4. Customizable Parameters: Tailor the indicator settings to align with your unique trading preferences and risk tolerance, ensuring a personalized trading experience.

  5. Reliable Performance: Backed by rigorous testing and real-market data, the Dynamic Scalper Indicator delivers consistent and reliable results.

  6. Compatible with Popular Platforms: Seamlessly integrate the indicator with leading trading platforms for hassle-free execution of trades.

  7. Mobile and Terminal Alerts

Whether you're a seasoned scalper or just starting your trading journey, the NAS30 Scalper Indicator empowers you to navigate the NAS100 and US30 markets with confidence, unlocking the potential for substantial profits in fast-moving environments. Don't miss out on this powerful tool to enhance your scalping strategy and achieve your financial goals!


Recommended products
PRICE ACTION Semi-auto trade bot:  (SPECIALLY DEIGNED FOR XAUUSD  ) This is a simple quantitative model that trades GOLD(XAUUSD) using automatic price action analysis algorithms Place it on any symbol or timeframe.  The position sizes are calculated by multiplying 0.01 per USD 500 on account to ensure low risk exposure and also leaving free margin for hedging positions that reduce the overall risk exposure . This is what leads to stability in the model though it is possible that the model like
FREE
FREE VERSION OF THE PRICE ACTION ADVANCED LEVELS  free on demo account. full product:  https://www.mql5.com/en/market/product/94338 Accurate horizontal support and resistance levels Accurate for price action analysis. All Markets: forex, stocks, indices, metals, commodities ,and crypto  Available for meta trader 5 Adjustable parameters inputs: For multiple timeframe analysis: adjust "analysis_timeframe"  accordingly "depth_of_retrenchments" represents how big the peaks or troughs are. "lookba
FREE
Boom and Crash Spike Detector v1.0 Boom and Crash spike detector prints Down non repaint Arrow for catching crash spikes and Up non repaint arrow for catching boom spikes.  It is suitable for 1M time frame for majorly crash500 and Boom 500.  When the Red arrow prints in a red zone moving averages, it indicates high probability of crash spikes downwards, likewise, blue arrow printing in a blue zone of moving average, it indicates high probability of boom spikes.  Its pretty straight forward since
PK Crash 5OO Light
Prudence Kiconco
PK Crash 500 Light  is an EA designed specifically to trade Crash 500 Index on the M1 Timeframe. The minimum deposit is 30 USD per 0.2 Lot Size for a 1:500 leverage account. PK Crash 500 Light shows stable trading results. PK Crash 500 Light only trades one direction. It only sells thus profiting from the drops that occur in the Crash 500 Index. This unique feature allows the EA to maximize your profits and minimize the drawdown. The Breakeven feature allows the EA to move the Stop loss to bre
Accurate horizontal support and resistance levels Accurate for price action analysis. All Markets: forex, stocks, indices, metals, commodities ,and crypto  Available for meta trader 5 Adjustable parameters I think that's it  inputs: For multiple timeframe analysis: adjust "analysis_timeframe"  accordingly "depth_of_retrenchments" represents how big the peaks or troughs are. "lookback " represents the most recent number of candlesticks to consider "linecolor " is the color of the lines "lineweig
Crash500 Spike Detector v1.0 Crash500 spike detector prints Down non repaint Arrow for catching crash spikes. It is suitable for 1M time frame for majorly crash500  When the Red arrow prints, it indicates high probability of crash spikes downwards. Its pretty straight forward since I designed it to follow strong trends.  Use default settings, however, you can change the color of your chart background as may be appropriate. The system uses mathematical approach in to display statistical data inf
ACCOUNT FLIPPER EA A trading bot for GBPUSD Lot size is calculated by  multiplying the lot factor by each 1000 USD on account.  Advisable to use account sizes of USD 1000 and above. Account types:   Hedge accounts, Standard accounts are preferred i.e. no commissions, Use well regulated brokers eg ICMarkets.  all this provides room for the strategy to work smoothly for stabilized results and removing the possibility of the model crashing. ADJUST The Time settings to your own time zone because the
FREE
PK Crash 5OO PRO
Prudence Kiconco
PK Crash 500 PRO  is an EA designed specifically to trade Crash 500 Index on the M5 Timeframe. The minimum deposit is 100 USD per 0.2 Lot Size for a 1:500 leverage account. PK Crash 500 PRO shows stable trading results. PK Crash 500 PRO only trades one direction. It only sells thus profiting from the drops that occur in the Crash 500 Index. This unique feature allows the EA to maximize your profits and minimize the drawdown. The trailing stop feature tracks 50% of the profit gained thus reduci
CandleStick 3 Candle Engulf
Francis Soddo Wetaka
3 (1)
The 3 Candlestick Engulf indicator is a candlestick pattern indicator that considers the last 3 bearish candles for a Bullish Engulf candlestick pattern signal and last 3 bullish candlesticks followed by a Bearish Engulf candlestick pattern for a bearish signal. Engulfs are also presented in both trending and non-trending situations of the market though recommended to move with signals that are in line with the trend basing on the moving average. The indicator has multiple input features that yo
FREE
PK Crash 3OO Light
Prudence Kiconco
PK Crash 300 Light  is an EA designed specifically to trade Crash 300 Index on the M2 Timeframe. The recommended deposit is 100 USD per 0.5 Lot Size for a 1:500 leverage account. PK Crash 300 Light shows stable trading results. PK Crash 300 Light only trades one direction. It only sells thus profiting from the drops that occur in the Crash 300 Index. This unique feature allows the EA to maximize your profits and minimize the drawdown. The Breakeven feature allows the EA to move the Stop loss t
Papa
Busingye Tusasirwe
5 (2)
Papa EA version 6.0  is based on Big Boy version 3.0. There are brand new trade ideas and functions that have been added. This makes Papa EA much better than Big Boy: think about it! And the inputs have not changed much. It means you still have a very simple-to-use EA in your hands. Just change BasicBalance to 55( or more) and set the EA on a 15Min EURUSD Chart. >>> Live PAPA EA Signal <<< Here are the inputs: 1)       ExpertComment(you can change it):   The basic comment used for each trade 2)
Quasimodo Genie
Francis Soddo Wetaka
Introducing the Quasimodo Genie, a powerful indicator for MetaTrader 5 that automatically identifies the Quasimodo or Over and Under pattern. This indicator is perfect for traders who want to take advantage of this popular chart pattern and make profitable trades. With the Quasimodo Genie, you can easily find the best swing points for the Quasimodo pattern and place virtual trades with stop loss and take profit levels. The Quasimodo Genie is easy to use and comes with a range of customizable set
FREE
PK Crash 1OOO PRO
Prudence Kiconco
PK Crash 1000 PRO  is an EA designed specifically to trade Crash 1000 Index on the M1 Timeframe. It doesn't trade frequently but it offers a high return of profits with lesser risk. The minimum deposit is 100 USD per 0.2 Lot Size for a 1:500 leverage account. PK Crash 1000 PRO shows stable trading results. PK Crash 1000 PRO only trades one direction. It only sells thus profiting from the drops that occur in the Crash 1000 Index. This unique feature allows the EA to maximize your profits and mini
Super Trend Master
Ronald Moses Mawanda
As the name suggests,   it indicates the direction of the price movement in a market that is trending, that is following any particular path . It is plotted in stock price charts for investors to see marked current trend which is shown in red when prices have dipped and green when prices have risen. Input Parameters: CCI Indicator period ATR Indicator Period CCI Activation level Horizontal Shift of Indicator Bars Otherwise ; You can use the Default settings
Engulfing goddess
Francis Soddo Wetaka
Introducing the Engulfing Goddess Metatrader 5 (MT5) Indicator , a revolutionary tool designed for traders who seek to harness the power of candlestick patterns in their trading strategy. This indicator is built on the principles of engulfing candlestick patterns , a popular method used by successful traders worldwide. Our Engulfing Goddess Indicator stands out with its ability to detect various kinds of engulfing patterns . It employs a range of filters, providing you with a comprehensive anal
Big Boy
Busingye Tusasirwe
Big Boy v3.0  is a new EA that has been designed to accurately trade on the EURUSD 15min timeframe. Please use it on EURUSD 15 Min Chart. It is very accurate, year in year out. Once downloaded, change the BasicBalance to 50 and attach on EURUSD 15 Min chart. Thank you for considering to buy and use this EA.  Here are the inputs: 1)     ExpertComment(you can change it):   The basic comment used for each trade 2)       ExpertMagic:   Unique identifier for trades opened by BigBoy 3)       AutoLots:
FREE
PK Boom Crash Scalper RSI  is an EA designed specifically for scalping Boom and Crash Indices on the M1 Timeframe. The EA uses the Relative Strength Index (RSI) indicator to open positions based on the Oversold and Overbought levels which can be adjusted to the users' preferences. Positions are opened after a spike or drop depending on the index being traded.  NB: This EA, unlike my other EA's, doesn't come with optimized parameters. It's up to the user to set it up according to their preferred
PK Crash 3OO EA
Prudence Kiconco
PK Crash 300 EA  is an EA designed specifically to trade Crash 300 Index on the M2 Timeframe. PK Crash 300 EA shows stable trading results. PK Crash 300 EA only trades one direction. It only sells thus profiting from the drops that occur in the Crash 300 Index. This unique feature allows the EA to maximize your profits and minimize the drawdown. The trailing stop feature tracks 50% of the profit gained thus reducing on the drawdown. PK Crash 300 EA is very simple to use. All you have to do is to
Advanced 4xZeovo MT5 Indicator (MetaTrader 5)   Product Description  4xZeovo is a powerful trading indicator system monitoring 24/7 financial markets. Metatrader5 tool designed to find the best buying/selling opportunities and notifies the user.    Making life easy for traders in helping with the two most difficult decisions with the use of advanced innovate trading indicators aiming to encourage users to hold the winning positions and take profit at the best times.    Equipped with a unique tra
Crash Wizard
Ronald Moses Mawanda
Crash Wizard Indicator works on 1 Minute time frame of Crash 500 and Crash 1000 ONLY. This indicator will plot a Red (x) on the Drop candle . it will plot Green arrows as BUY entry signal and will plot orange (x) as multi-exit points. You the indicator is 85% Accurate . you may use it together with Price action. NOTE: To use the indicator , make sure you have an account with Deriv the only synthetics indices broker. DONT use it on any other assets.
All about time and price by ICT. This indicator provides a comprehensive view of ICT killzones, Silver Bullet times, and ICT Macros, enhancing your trading experience.  In those time windows price either seeks liquidity or imbalances and you often find the most energetic price moves and turning points. Features: Automatic Adaptation: The ICT killzones intelligently adapt to the specific chart you are using. For Forex charts, it follows the ICT Forex times: In EST timezone: Session: Asia: 20h00-0
Three EMA Trend Entry
Francis Soddo Wetaka
5 (4)
This Indicator is based on 4 Exponential Moving Averages ie. 3 EMA-32 (applied to prices close, high & low), and EMA-200 (indicating trend direction). The EMA32-200 produces quality buy and sell entries indicated by arrows and signal alert that appears whenever the price moves above the EMA-200 and returns below the EMA-32s and returns to break above the previous swing high triggering a high probability buy entry. The Sell conditions are the opposite of the buy conditions.
FREE
Gino Renko
Stephane, Andr Valette
1 (1)
Another renko-based indicator. It returns different usable values ​​for an EA, and is directly displayed on the main chart. Its setting is very simple: The size of the renko The number of bars taken into account The falling color The color on the rise Returned values: Buffer 0 : Value of the middle Buffer 1 : Value of the Top Buffer 2 : Value of the Bottom Buffer 3 : Direction of renko (0.0 for top ; 1.0 for bottom) Buffer 4 : Ratio of the renko, for example, if it is twice, 3 times, ro more of
Renko Charts Pro
Makarii Gubaydullin
Filter out small price movements and focus on the larger trend . Renko chart indicator will help you to filter out a minor price movements so that you can focus on the overall trend. The price must move a specified amount to create a Renko brick. This makes it easy to spot the current trend direction in which the price is moving. My  #1 Utility : includes 65+ features  |   Contact me  if you have any questions  |    MT4 version In the settings of the indicator, you can configure: Calculation Se
LineaMMSuavizado
Cesar Juan Flores Navarro
Se considera la secuencia de la serie Fibonacci (2,3,5,8,13) que sera multiplicado por un periodo (11 o 33 o 70 etc.), de las 5 lineas se sacara una sola que sera contendrá el máximo y mínimo de las 5, a esta linea se le aplicara un suavizador de 3....y a esta linea suavizada se le volverá a aplicar un suavizador de 3. obteniéndose 2 lineas suavizadas. A simple vista se ve las intersecciones que hacen las lineas que pueden ser usadas para comprar o vender. Cambien se puede usar con apoyo de otro
PK Crash 5OO EA
Prudence Kiconco
PK Crash 500 EA  is an EA designed specifically to trade Crash 500 Index on the M1 Timeframe. The minimum deposit is 100 USD per 0.2 Lot Size for a 1:500 leverage account. PK Crash 500 EA shows stable trading results. PK Crash 500 EA only trades one direction. It only sells thus profiting from the drops that occur in the Crash 500 Index. This unique feature allows the EA to maximize your profits and minimize the drawdown. This EA only uses the stop loss feature. It automatically closes trades
PK Crash 1OOO EA
Prudence Kiconco
PK Crash 1000 EA is an EA designed specifically to trade Crash 1000 Index on the M2 Timeframe. The minimum deposit is 100 USD per 0.2 Lot Size for a 1:500 leverage account. PK Crash 1000 EA shows stable trading results. PK Crash 1000 EA only trades one direction. It only sells thus profiting from the drops that occur in the Crash 1000 Index. This unique feature allows the EA to maximize your profits and minimize the drawdown. The trailing stop feature tracks 50% of the profit gained thus reduc
Fibo Expertt
Ignacio Agustin Mene Franco
Fibo expert! It is an automatic fibonacci indicator. adapting to any temporality, to catch those rebounds, or the path of that trend, special to make longs in H1 or H4 clear the trend, but it also works for scalp in m1 up to m15 works for all forex pairs and for all pairs of synthetic indices, ideal for volatility 75 in synthetics no more to enjoy good profit World Investor.
Bands are a form of technical analysis that traders use to plot trend lines that are two standard deviations away from the simple moving average price of a security. The goal is to help a trader know when to enter or exit a position by identifying when an asset has been overbought or oversold. This indicator will show upper and lover bands. You can change input parameters nPeriod and  nMethod to calculate those bands for each timeframe. Aqua clouds represent up or down trends.
KT Renko Live Charts MT5
KEENBASE SOFTWARE SOLUTIONS
KT Renko Live Chart utility creates the Renko charts on MT5 that can be further used for speculation or live trading. The Renko chart created by this utility supports most of the custom indicators and automated Expert Advisors. Fully compatible with our Renko Patterns indicator and Renko Patterns EA . Features A simple and straightforward Renko utility that provides the Renko chart on MT5 without any complicated settings. It supports most of the custom indicators and Expert Advisors for 100%
Buyers of this product also purchase
TPSpro RFI Levels MT5
Roman Podpora
4.73 (11)
INSTRUCTIONS    RUS   -    ENG           R ecommended to use with an indicator   -   TPSpro  TREND PRO -  Version MT4                 A key element in trading is zones or levels from which decisions to buy or sell a trading instrument are made. Despite attempts by major players to conceal their presence in the market, they inevitably leave traces. Our task was to learn how to identify these traces and interpret them correctly. Main functions:: Displaying active zones for sellers and buyers! T
Atomic Analyst MT5
Issam Kassas
4.42 (19)
First of all Its worth emphasizing here that this Trading Indicator is   Non-Repainting   , Non Redrawing and Non Lagging Indicator   Indicator, Which makes it ideal from both manual and robot trading.  User manual: settings, inputs and strategy . The Atomic Analyst  is a PA Price Action Indicator that uses Strength and Momentum of the price to find a better edge in the market. Equipped with Advanced filters which help remove noises and false signals, and Increase Trading Potential. Using Mult
First of all Its worth emphasizing here that this Trading System is Non-Repainting   , Non Redrawing and Non Lagging Indicator Which makes it ideal from both manual and robot trading .  Online course, manual and download presets. The Smart Trend Trading System MT5 is a comprehensive trading solution tailored for new and experienced traders . It combines over 10 premium indicators and features more than 7 robust trading strategies , making it a versatile choice for diverse market conditions . Tre
FxaccurateLS
Shiv Raj Kumawat
WHY IS OUR FXACCCURATE LS MT5 THE PROFITABLE ? PROTECT YOUR CAPITAL WITH RISK MANAGEMENT Gives entry, stop and target levels from time to time. It finds Trading opportunities by analyzing what the price is doing during established trends. POWERFUL INDICATOR FOR A RELIABLE STRATEGIES We have made these indicators with a lot of years of hard work. It is made at a very advanced level. Established trends provide dozens of trading opportunities, but most trend indicators completely ignore them!
How many times have you bought a trading indicator with great back-tests, live account performance proof with fantastic numbers and stats all over the place but after using it, you end up blowing your account? You shouldn't trust a signal by itself, you need to know why it appeared in the first place, and that's what RelicusRoad Pro does best! User Manual + Strategies + Training Videos + Private Group with VIP Access + Mobile Version Available A New Way To Look At The Market RelicusRoad is
Gann Squares Indicator: Analyzing Markets with Geometric Patterns The Gann Squares indicator is a powerful tool for market analysis that draws upon the mathematical concepts introduced by W.D. Gann in his article on "Mathematical Formula for Market Predictions." This indicator incorporates Gann's techniques involving square numbers such as 144, 90, and 52, as well as the Square of 9. Additionally, it incorporates  method for utilizing the Square of 9 in conjunction with channels and the star pa
TPA True Price Action indicator reveals the true price action of the market makers through 100% non-repainting signals strictly at the close of a candle! TPA shows entries and re-entries, every time the bulls are definitely stronger than the bears and vice versa. Not to confuse with red/green candles. The shift of power gets confirmed at the earliest stage and is ONE exit strategy of several. There are available now two free parts of the TPA User Guide for our customers. The first "The Basics"
AT Forex Indicator MT5
Marzena Maria Szmit
5 (4)
The AT Forex Indicator MT5 is a sophisticated trading tool designed to provide traders with a comprehensive analysis of multiple currency pairs. This powerful indicator simplifies the complex nature of the forex market, making it accessible for both novice and experienced traders. AT Forex Indicator uses advanced algorithms to detect trends, patterns and is an essential tool for traders aiming to enhance their forex trading performance. With its robust features, ease of use, and reliable signal
TrendMaestro5
Stefano Frisetti
note: this indicator is for METATRADER4, if you want the version for METATRADER5 this is the link:  https://www.mql5.com/it/market/product/108106 TRENDMAESTRO ver 2.4 TRENDMAESTRO recognizes a new TREND in the bud, he never makes mistakes. The certainty of identifying a new TREND is priceless. DESCRIPTION TRENDMAESTRO identifies a new TREND in the bud, this indicator examines the volatility, volumes and momentum to identify the moment in which there is an explosion of one or more of these data a
THIS INDICATOR, BASED ON ARTIFICIAL INTELLIGENCE, identifies possible market reversal points by reading the footprint, and signals IN ADVANCE small market movements before they occur. Unlike price and volume indicators, which generate "late" entries, i.e. when a confirmation in price or volume has already occurred on a change in direction, and therefore often the movement has already ended, this indicator signals, based on what it reads in the footprint, "WHEN THE MOVEMENT SHOULD HAPPEN" and th
XQ Indicator MetaTrader 5
Marzena Maria Szmit
3 (2)
Step into the realm of Forex trading with confidence and precision using XQ, a cutting-edge Forex indicator designed to elevate your trading game to unprecedented heights. Whether you're a seasoned trader or just stepping into the world of currency exchange, XQ Forex Indicator empowers you with the insights and signals needed to make informed trading decisions. The signal conditions are a combination of three indicators, and XQ Forex Indicator only display  medium and long-term trends . The ind
Go Way TREND
Ywsf Hsyn Hmad Alrsh
Go with the trend. Yes, wait for the entry signal, whether buy or sell, on a 15-minute frame, and check the signal if it appears on a 30-minute frame (sometimes it takes an hour or more for the signal to appear. You can return to the 15-minute frame and return to the 30-minute frame, and repeat this until the main signal appears for you. If the signal appears on the 30-minute frame, enter with the price and profit is taken when the drawing line changes, profit is booked, or when an opposite si
Fxaccurate TCT
Shiv Raj Kumawat
WHY IS OUR FXACCCURATE TCT MT5 THE PROFITABLE ? Gives entry, stop and target levels from time to time. It finds Trading opportunities by analyzing what the price is doing during established trends. We have made these indicators with a lot of years of hard work. It is made at a very advanced level. Established trends provide dozens of trading opportunities, but most trend indicators completely ignore them! The trend reveals trading indicator represents an average of 10 different trades per trend
Trade smarter, not harder: Empower your trading with Harmonacci Patterns Special Offer: Purchase now to receive free bonuses worth $165! (Read more for details) This is arguably the most complete harmonic price formation auto-recognition indicator you can find for the MetaTrader Platform. It detects 19 different patterns, takes fibonacci projections as seriously as you do, displays the Potential Reversal Zone (PRZ) and finds suitable stop-loss and take-profit levels. [ Installation Guide | Up
Satoro mt5
Mykhailo Lozhkin
An indicator based on time-tested trading methods that gives a signal that the market is overbought or oversold in a certain period of time The indicator does not disappear when it appears, easy to use Suitable for any trade It can be used on any currency pair or crypto He performed best in the period H1,H4,daily After the purchase, you will also receive a seller's template with settings The seller uses it more for trading on cryptocurrency After the purchase, I also keep in touch
IVISTscalp5
Vadym Zhukovskyi
5 (5)
What's new about iVISTscalp5 forecast indicator (Version 10)? iVISTscalp5 is a unique nonlinear forecasting for a week ahead system for any financial instrument which executes fast scalping using time levels. iVISTscalp5 is a tool for easy study and understanding of financial market. 1) iVISTscalp5 forecast indicator has been completely rewritten into another programming language (C++), which has accelerated data loading and processing. As a result, a different graphical display of forecast
MetaForecast M5
Vahidreza Heidar Gholami
5 (2)
MetaForecast predicts and visualizes the future of any market using different powerful methods. While financial markets are not always predictable, if there are patterns in the past data, MetaForecast can learn and predict the future as accurately as possible. It features a complete implementation of neural networks embedded directly into the indicator, enabling traders to create and train AI models using data from multiple symbols to learn complex patterns. MetaForecast leverages your computer'
Introduction to X3 Chart Pattern Scanner X3 Cherart Pattern Scanner is the non-repainting and non-lagging indicator detecting X3 chart patterns including Harmonic pattern, Elliott Wave pattern, X3 patterns, and Japanese Candlestick patterns. Historical patterns match with signal patterns. Hence, you can readily develop the solid trading strategy in your chart. More importantly, this superb pattern scanner can detect the optimal pattern of its kind. In addition, you can switch on and off individu
Noize Absorption Index - is the manual trading system that measures the difference of pressure between bears forces and bulls forces. Green line - is a noize free index that showing curent situation. Zero value of index shows totally choppy/flat market.Values above zero level shows how powerfull bullish wave is and values below zero measures bearish forces.Up arrow appears on bearish market when it's ready to reverse, dn arrow appears on weak bullish market, as a result of reverse expectation.
Boom and Crash Trend Detector is a  Non-Repaint   MT5 trading system usually being sold for 50 0$ . Most people use this for Deriv but can be used to forex too. The boom and crash spike indicator is a spike detecting software, with Multiple features, these features include. Spike Alert ( from 10 to 100-second warning before spike) Continues spike Alert (for double or continuous spikes at a time) supports all Boom/crash Indices M6 time frame works best here . Bigger time frame trend pointer f
Introduction to Fractal Pattern Scanner Fractal Indicator refers to the technical indicator that makes use of the fractal geometry found in the financial market. Fractal Pattern Scanner is the advanced Fractal Indicator that brings the latest trading technology after the extensive research and development work in the fractal geometry in the financial market. The most important feature in Fractal Pattern Scanner is the ability to measure the turning point probability as well as the trend probabil
Volatility Trend System - a trading system that gives signals for entries. The volatility system gives linear and point signals in the direction of the trend, as well as signals to exit it, without redrawing and delays. The trend indicator monitors the direction of the medium-term trend, shows the direction and its change. The signal indicator is based on changes in volatility and shows market entries. The indicator is equipped with several types of alerts. Can be applied to various trading in
Native Channels
BeeXXI Corporation
5 (1)
This indicator recognizes all support and resistance levels. A number of unique high-performance techniques have been applied, which made the existence of this indicator possible. All formed channels are naturally visible: horizontal linear linear parabolic cubic (Polynomial 3 degrees - Wave) This is due to a bundle of approximating channels. The formed channels form "standing waves" in a hierarchical sequence. Thus, all support and resistance levels are visible. All parameter management is
Elliot Waves Analyzer Pro
Viktor Weidenthal
2.67 (3)
Elliot Waves Analyzer Pro calculates Elliot Waves to Help Identify Trend direction and Entry Levels. Mainly for Swing Trading Strategies. Usually one would open a Position in trend direction for Wave 3 or a Correction for Wave C . This Indicator draws Target Levels for the current and next wave. Most important Rules for Elliot Wave Analysis are verified by the Indicator.  The Pro version analyzes Multiple Timeframes and shows the Subwaves and Target-Levels.   For an Overview  " Elliot Waves Anal
Piranha version 2
Maria Strudov
5 (1)
"Piranha" - an autonomous trading system that determines overbought and oversold levels on the chart. Red and blue zones represent overbought and oversold levels respectively. Entry points are marked with arrows: a downward arrow in the red zone for "sell" and an upward arrow in the blue zone for "buy". The Take profit level is indicated by the green moving average. Key features: Adjusting the Take profit level as the green moving average changes position. Averaging ability when a new market e
The iChannels
BeeXXI Corporation
5 (2)
Ultra-fast recognition of parabolic channels (as well as linear, horizontal and wavy channels) throughout the depth of history, creating a hierarchy of channels. Required setting: Max bars in chart: Unlimited This indicator is designed primarily for algorithmic trading, but can also be used for manual trading.  This indicator will have a very active evolution in the near future and detailed descriptions on how to apply to create robots
How to use Pair Trading Station Pair Trading Station is recommended for H1 time frame and you can use it for any currency pairs. To generate buy and sell signal, follow few steps below to apply Pair Trading Station to your MetaTrader terminal. When you load Pair Trading Station on your chart, Pair Trading station will assess available historical data in your MetaTrader platforms for each currency pair. On your chart, the amount of historical data available will be displayed for each currency pai
First of all Its worth emphasizing here that this Trading System is Non-Repainting, Non-Redrawing and Non-Lagging Indicator, Which makes it ideal for professional trading. Online course, user manual and demo. The "Smart Support and Resistance Trading System" is an advanced indicator tailored for  new  and  experienced  traders. It empowers traders with precision and confidence in the forex market. This comprehensive system combines 7+ strategies, 10 indicators, and various trading approaches,
SMCpro
Arief
5 (1)
Currently Price  20% OFF  ( for unlimited use ) Indicator   USER MANUAL , trade setups, solving issues, etc :  Direct Download Here     (  for users only  ) Hello World! Introducing.. SMCpro tool and Indicator for  MetaTrader 5 , a cutting-edge feature designed to revolutionize your trading experience. With innovative ICT Smart Money Concept, you gain unparalleled insight into market dynamics, empowering you to make informed trading decisions like never before. SMC Indicator built on th
Elliott Wave Trend was designed for the scientific wave counting. This tool focuses to get rid of the vagueness of the classic Elliott Wave Counting using the guideline from the template and pattern approach. In doing so, firstly Elliott Wave Trend offers the template for your wave counting. Secondly, it offers Wave Structural Score to assist to identify accurate wave formation. It offers both impulse wave Structural Score and corrective wave Structure Score. Structural Score is the rating to sh
More from author
Crash Wizard
Ronald Moses Mawanda
Crash Wizard Indicator works on 1 Minute time frame of Crash 500 and Crash 1000 ONLY. This indicator will plot a Red (x) on the Drop candle . it will plot Green arrows as BUY entry signal and will plot orange (x) as multi-exit points. You the indicator is 85% Accurate . you may use it together with Price action. NOTE: To use the indicator , make sure you have an account with Deriv the only synthetics indices broker. DONT use it on any other assets.
Super Trend Master
Ronald Moses Mawanda
As the name suggests,   it indicates the direction of the price movement in a market that is trending, that is following any particular path . It is plotted in stock price charts for investors to see marked current trend which is shown in red when prices have dipped and green when prices have risen. Input Parameters: CCI Indicator period ATR Indicator Period CCI Activation level Horizontal Shift of Indicator Bars Otherwise ; You can use the Default settings
Filter:
No reviews
Reply to review