Easy ICT Price Action MT4
- Indicators
- Han Qin Lin
- Version: 7.7
- Updated: 30 December 2023
- Activations: 10
ICT, SMC, Smart Money Concept, Support and Resistance, Trend Analysis, Price Action, Market Structure, Order Blocks, Breaker Blocks, Momentum Shift, Strong Imbalance, HH/LL/HL/LH, Fair Value Gap, FVG, Premium & Discount Zones, Fibonacci Retracement, OTE, Buyside Liquidity, Sellside Liquidity, Liquidity Voids, Market Sessions ,Market Time, , NDOG, NWOG,Silver Bullet,ict template
In the financial market, accurate market analysis is crucial for investors. To help investors better understand market trends and liquidity, we provide a user manual for advanced market analysis. Here is a brief introduction to some of the features and their implementation methods:
1. Display High-Timeframe Market Structure:
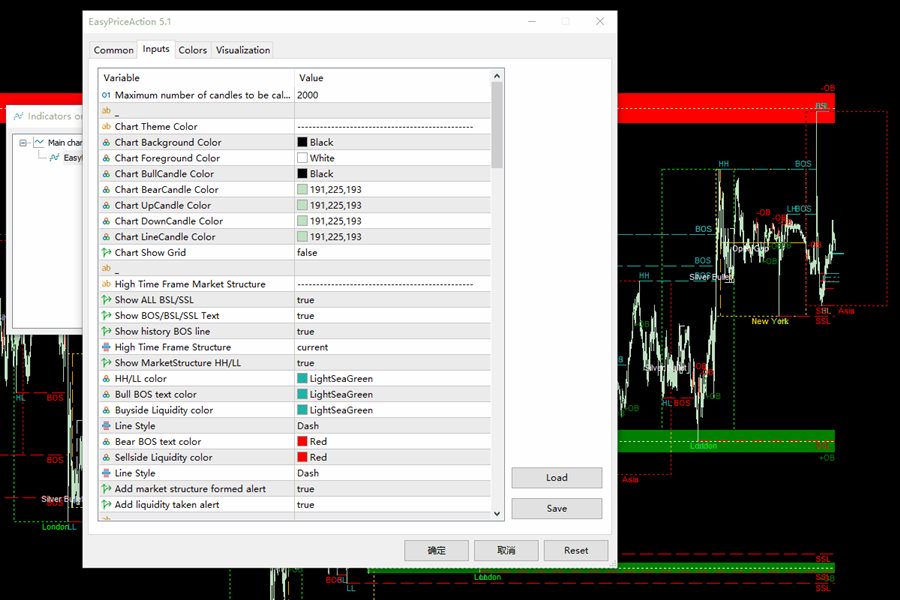
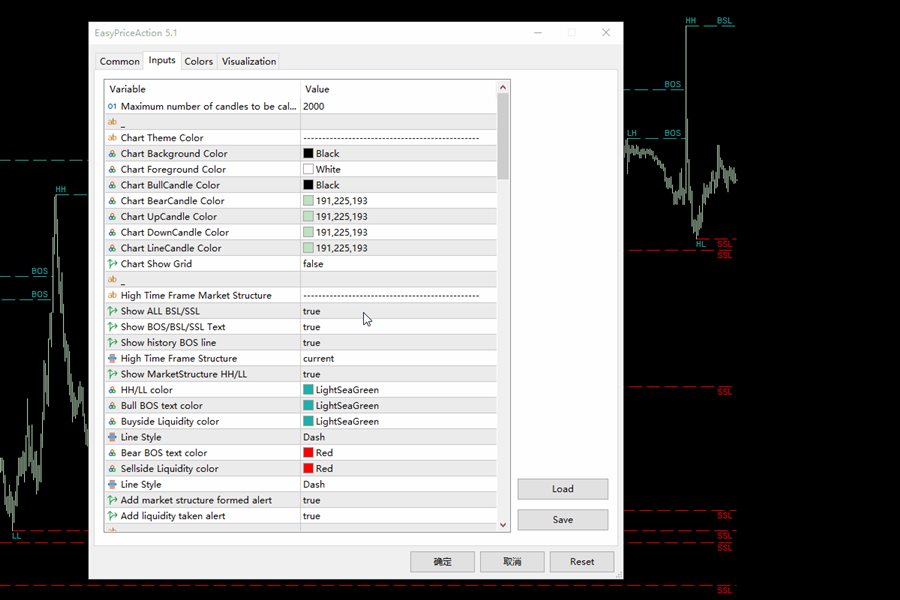
By setting parameters, you can display the high-timeframe market structure on the chart. This will help you better understand the overall market trends and structure. You can customize the time frame according to your needs and display the market structure on the chart.
2. Display Liquidity:
Liquidity is one of the important indicators in the market. By setting parameters, you can display the liquidity of buyers and sellers on the chart. You can customize the text and colors to better identify different levels of liquidity. You can also choose to display liquidity during the London AM session and New York lunchtime.
3. Display Fair Value Gap:
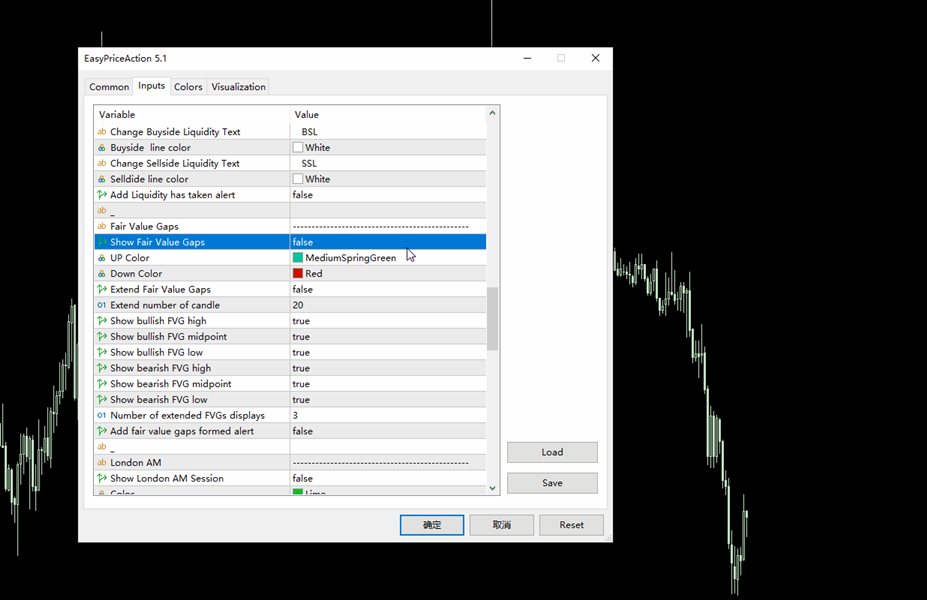
Fair value gap refers to the difference between market price and fair value. By setting parameters, you can display the fair value gap on the chart and use different colors to indicate whether it is rising or falling. This will help you better understand the supply and demand relationship in the market.
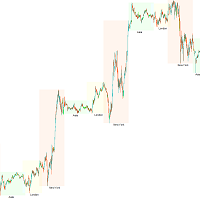
4. Display London AM Session:
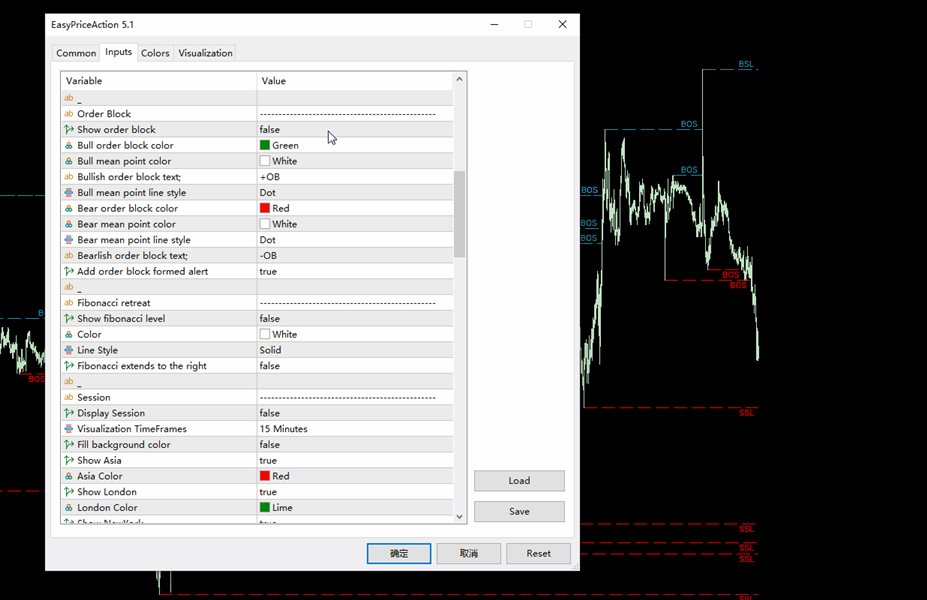
The London AM session is an important time period in the forex market. By setting parameters, you can display the time range of the London AM session on the chart and customize the background color and line style. This will help you better grasp the characteristics and trends of the London market.
5. Display New York Opening Time:
The New York opening time is another important time point in the forex market. By setting parameters, you can display the New York opening time on the chart and customize the colors and line styles. This will help you better understand the opening situation of the New York market.
6. Display Opening Range Gap:
Opening range gap refers to the difference between the market opening price and the previous day's closing price. By setting parameters, you can display the opening range gap on the chart and customize the colors for identification. This will help you better understand the market opening situation.
7. Display Silver Bullet Time:
Silver Bullet Time refers to special time points in the market. By setting parameters, you can display the Silver Bullet Time on the chart and customize the colors for identification. This will help you better grasp important opportunities in the market.
8. Display New York AM Session:
The New York AM session is another important time period in the forex market. By setting parameters, you can display the time range of the New York AM session on the chart and customize the background color and line style. This will help you better grasp the characteristics and trends of the New York market.
9. Display New York PM Session:
The New York PM session is another important time period in the forex market. By setting parameters, you can display the time range of the New York PM session on the chart and customize the background color and line style. This will help you better grasp the characteristics and trends of the New York market.
10. Display Previous High/Low Price Levels on a Daily/Weekly/Monthly Basis:
By setting parameters, you can display the previous high and low price levels on the chart on a daily, weekly, and monthly basis. This will help you better understand the price trends and important levels in the market.
These are some of the features and implementation methods of our advanced market analysis. You can adjust the parameters according to your needs and add the code snippets to your code to achieve the desired functionality. We hope this user manual will help you better analyze and make decisions in the market. Good luck with your investments!
Easy ICT Price Action User Guide

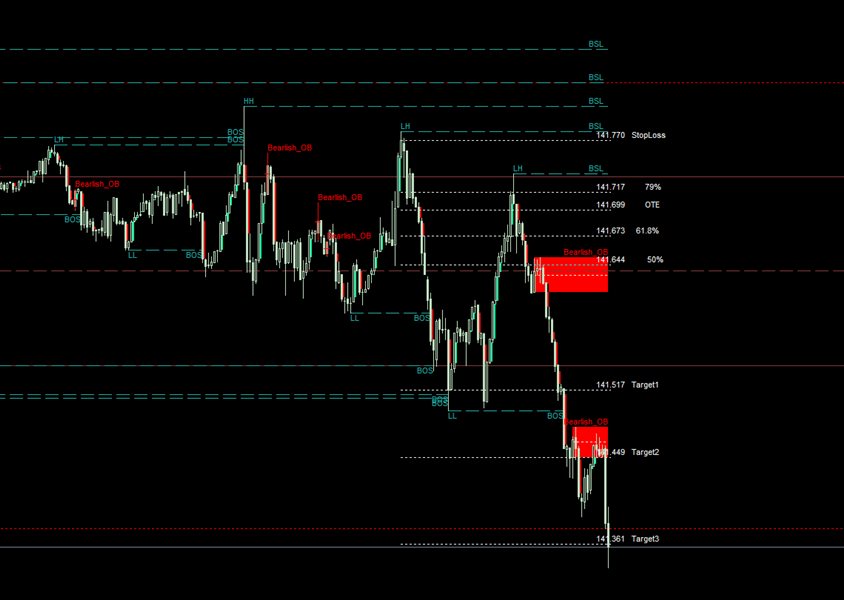
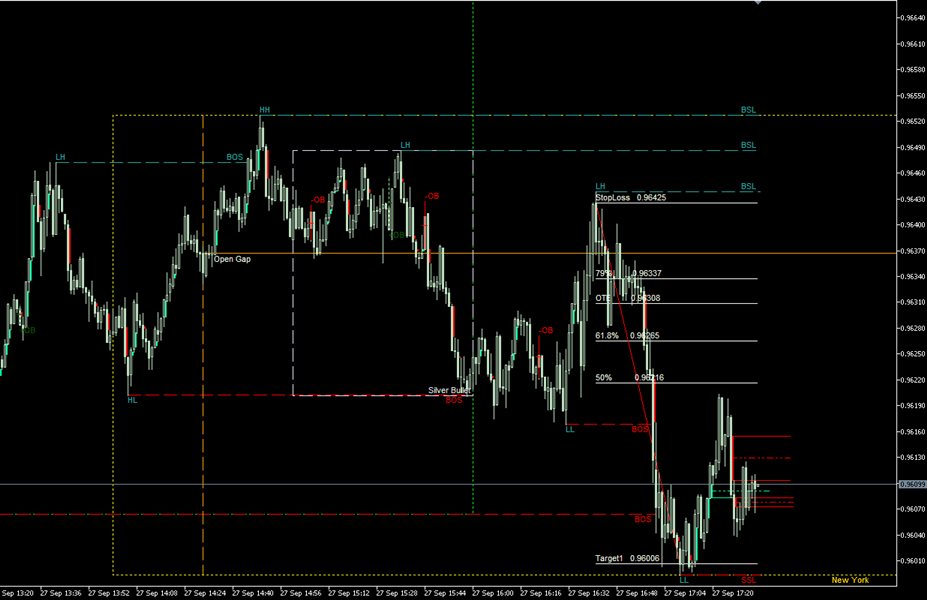
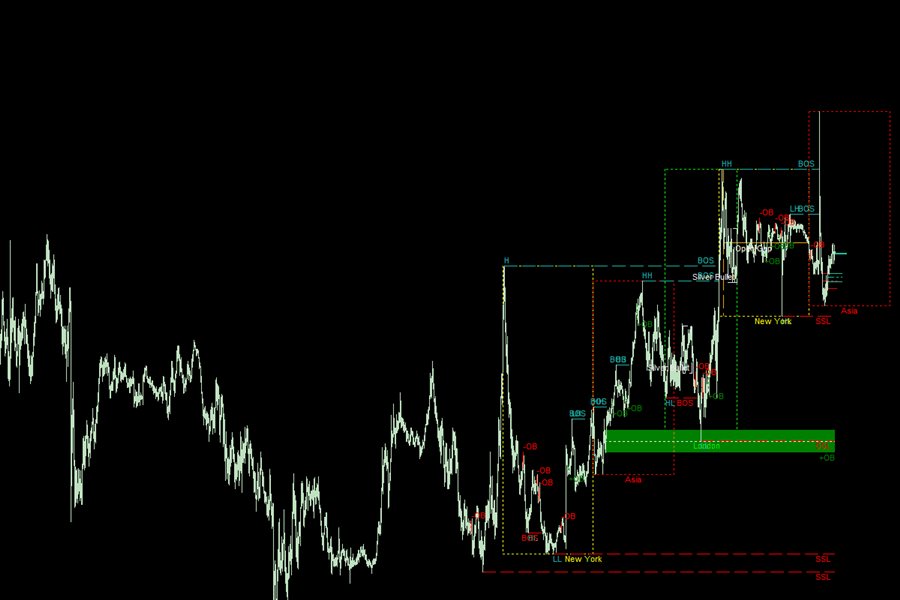







This indicator provides a good overview. You can find good trade entries based on the indicator and the target is also clearly defined. What is missing is a display on which you can see the higher TF in the structure, i.e. an MTF display. That is a great pity.