Order Book
- Indicators
- Thomas Bradley Butler
- Version: 2.0
- Updated: 13 July 2023
- Activations: 5
Added profile support and resistance.
See accumulated clusters from the volume profile. Small time frames are better to see clear clusters, the larger time frames and candles more is needed so the clusters will blend together but the accumulated panel is there to show the totals.
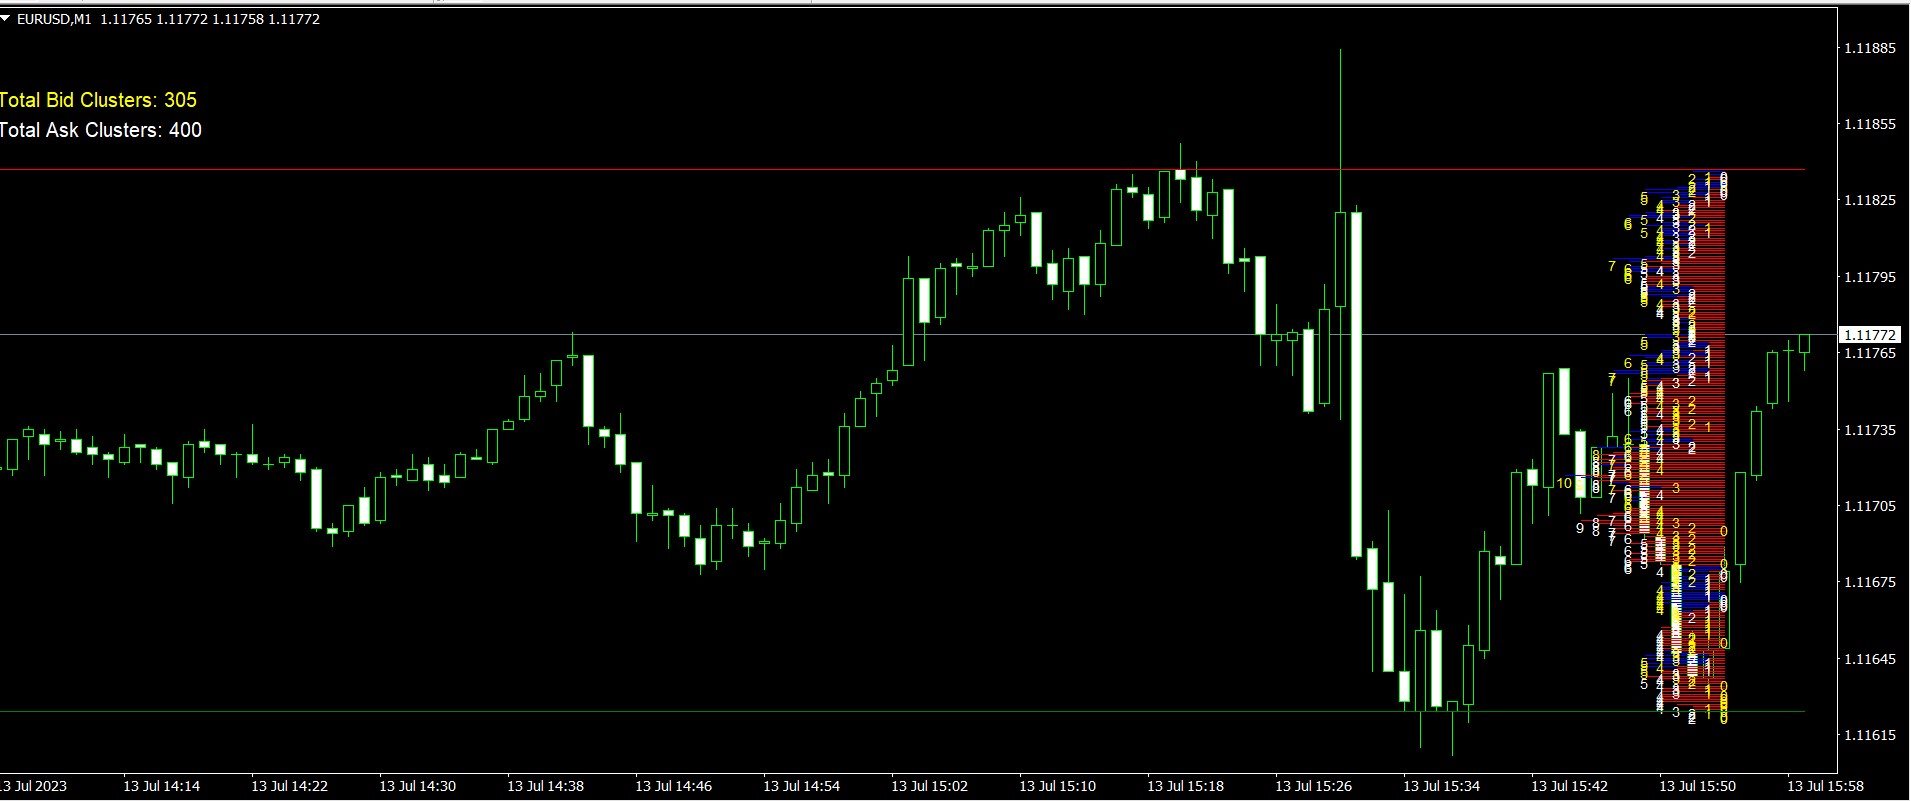
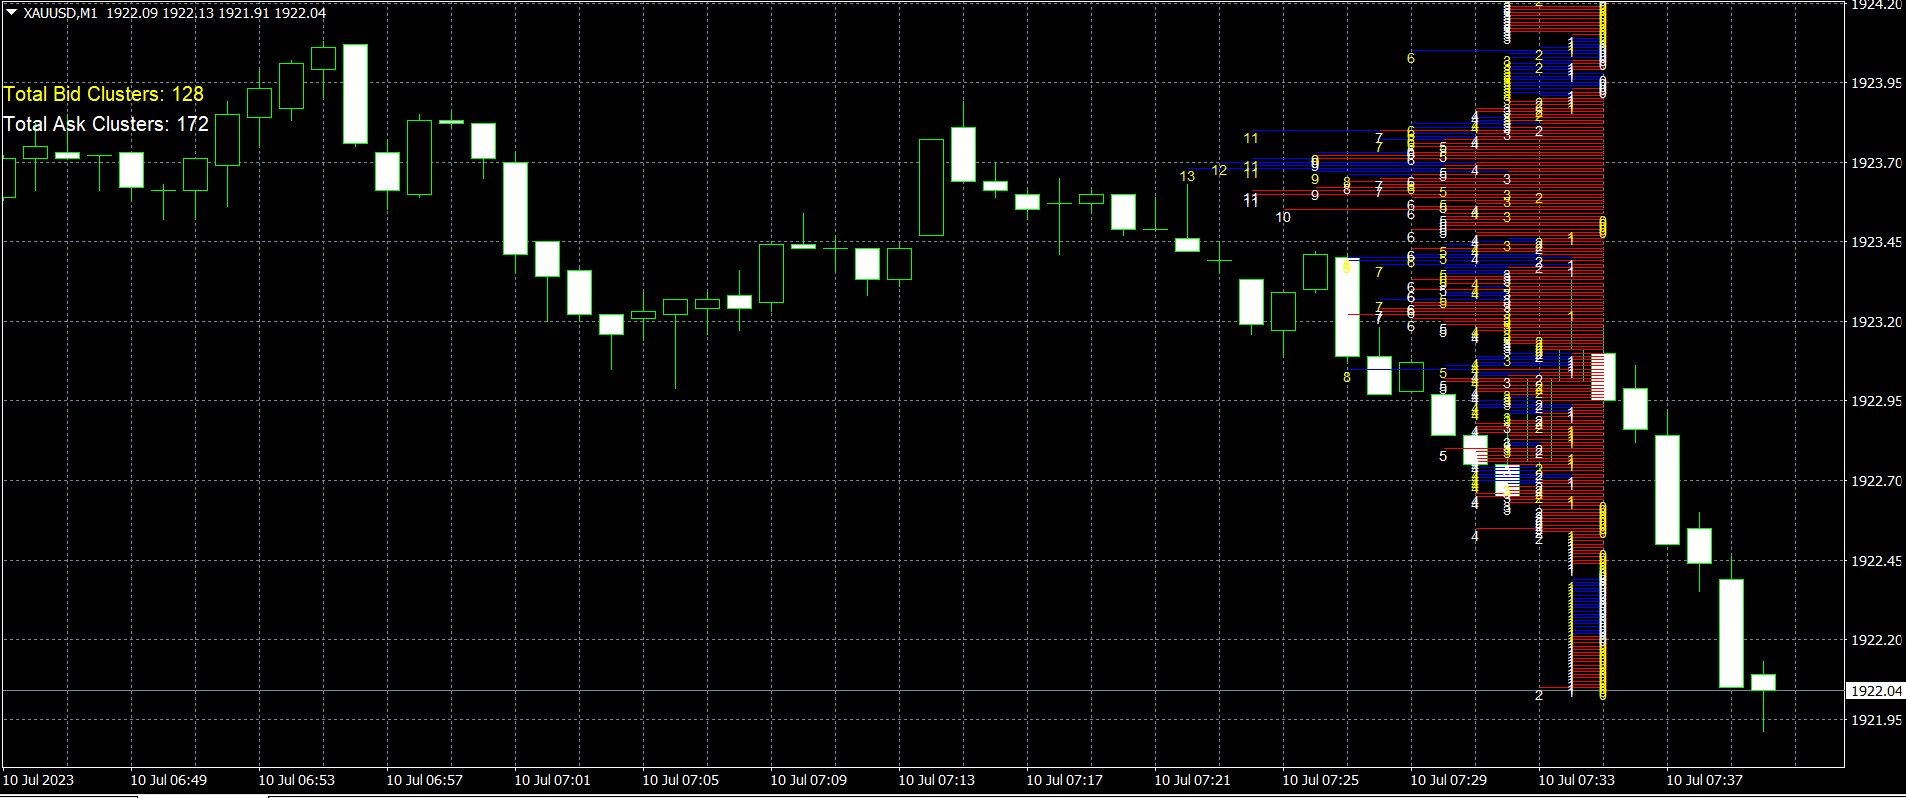
The "Order Book " indicator displays a histogram on the price chart representing the bid and ask volume clusters.
The indicator analyzes the historical price data and calculates the bid and ask volume clusters for each price level within a specified number of bars. The bid volume clusters are shown in blue, while the ask volume clusters are shown in red.
The indicator provides information about the distribution of bid and ask volumes at different price levels. Traders can use this information to identify areas of high trading activity and potential support/resistance levels. The histogram bars represent the number of bid and ask clusters at each price level, providing a visual representation of market liquidity.
In addition to the histogram bars, the indicator also displays text labels showing the total number of bid and ask clusters in the analyzed period. These labels are updated in real-time as new price data becomes available.