Watch the Market tutorial videos on YouTube
How to buy а trading robot or an indicator
Run your EA on
virtual hosting
virtual hosting
Test аn indicator/trading robot before buying
Want to earn in the Market?
How to present a product for a sell-through
Trading utilities for MetaTrader 5 - 18

AnaliTickDemo is a demo version of AnaliTick. AnaliTIck is a financial instrument analysis and testing program based on the Metatrader5 platform. The object of analysis is the sequence of changes in the prices of Bid and Ask - ticks. The program may be useful to developers of scalping advisers and strategies, those who work on the news. The demo version differs from the full one in fewer filters and strategies. The analyzed period is one - the current trading day and two previous days. The strat
FREE

Hi you, I need your help! Be my Patron, let's make it possible!
https://www.patreon.com/joaopeuko https://github.com/Joaopeuko/Mql5-Python-Integration
It works.
*****REVISADO*****DIA 31/12/2019 (dd/mm/yyyy) - EA continua funcionando perfeitamente, apesar do comentário feedback negativo.
Simples Expert Advisory para trades feitos de forma manual.
O EA coloca o Stop Loss (SL) e o Take Profit(TP) de e automática quando o Trade acontece.
O EA trabalha com números inteiros e fracionados, tan
FREE
A service to keep the SQLite database up to date . Fast real -t ime operation . Saves open positions and orders , current quotes , and trading history . Take advantage of SQLite 's capabilities for intermediate data storage , analytics , and integration of the MetaTrader platform . Save all your data in one place . Use the saved data in SQL analytical queries , from Python and other la
FREE

This script is a very useful tool when it comes to practicing chart analysis.
If you activate this script, you are going to be thrown down on a random chart position. The active chart is used where you are right now. You need to have at least 6000 historical bars. You can set the number of bars at: Tools->Charts tab->"Max bars in chart"
Should you have any questions, comments feel free to contact me.
FREE

Broker Desynchronization script MT5 is a script in the form of an EA. It will check the desynchronization of a BROKER's server compared to your time at your PC.
Usually BROKER sets time forward to have some space to execute trades.
If you wish to check how big the difference is, please load the EA to any chart.
After loading, it will wait for the first tick to check the desynchronization.
Information will be available for 10 seconds.
NOTE!
If market is closed, you get information to try again la
FREE
Este script permite abrir operaciones de forma rápida con un loteo automático basado en el "equity".
También permite habilitar/deshabilitar la colocación de SL y TP al hacer clic en un botón. Si se habilita el SL o el TP, también se tiene la posibilidad de establecer el riesgo que se desea tomar en pips.
* Se recomienda ocultar los botones de compra y venta originales.
FREE
This utility keeps a watchful eye on your trading terminals and ensures that you are notified if any of them are disconnected. Simply attach the utility to a chart and connect to a monitoring service who can notify you.
We use UptimeRobot for both VPS and terminal monitoring; however, any service supporting heartbeat monitoring can be employed.
Many such services offer free plans and various notification methods, such as Cronitor.io
FREE

The script analyzes all trading instruments listed in the Market Watch of the MT5 platform to assess their suitability for trading on the timeframes specified in the settings. Based on the analysis, the script displays a table, where trading instruments deemed suitable and recommended for trading are marked in green, based on their compliance with the risk-to-reward ratio coefficient, including the spread (default 1:3). Instruments not recommended for trading are marked in red.
FREE

多数の通貨を取引している場合、画面をカチャカチャ切り替えの際にどの通貨を見ているか 迷ったことはありませんか。 表示している通貨が大きく表示されるMT4用のインジケーターは あるのですがMT5用がなかったので作成しました。
機能: どの通貨でも表示可能になります。 表示位置 (左上 、 右上 、 左下 、 右下) の 指定 が可能 になります。 表示位置(X軸、Y軸)が変更可能 になります。 フォントの色を 変更可能 になります。 使用するフォント を指定することが可能になります。 フォントサイズ の 変更が可能 になります。 インストール方法: ファイル->データフォルダーを開く->MQL5フォルダー->Indicatorsフォルダー 配下にex5ファイルを置いてMT5を再起動してください。
FREE

Trade Saver Service
Application Type: Service
Application Features: Automated search and saving of trading results for multiple systems into text files for further analysis About the Application The service automatically saves the results of closed positions for a list of trading systems into text files, creating a personalized file for each system. How to Use Parameters: LOG_LEVEL - Logging level in the terminal’s Experts section. DEBUG provides the most detailed logs, while ERROR provides m
FREE

Assistant_for_Reopen - an Expert Advisor that helps to re-set pending orders. Many brokers force the order to expire at the end of the trading session or at the end of the trading day. Therefore, a trader has to restore all pending orders manually every time at the beginning of a new trading session. Assistant_for_Reopen frees the trader from this routine work. It controls expiration by the order expiration time and resets it if the trader ticked the checkbox. The maximum number of orders the EA
FREE
Clean all symbols from a chart to get a better view. We all love to draw a chart, but it's hard to get the unwanted objects away that we don't need anymore. With this script, you simply remove ONLY SYMBOLS. All others will stay on the chart. In my eyes, a must-have tool in case you need to clean quick up to continue observations or strategy finding. Just pull it onto the chart.
KEEP IT GROWING! Happy Trading
FREE

Utility service available to be used with the scripts from Wellington Silva .
The service regularly consults the authorized series of B3 options (Brazilian Exchange).
The service does not have any direct functionality and must be used in conjunction with the available scripts. See this link on how to install the service on your MT5 terminal. If you have any questions, please contact us via Telegram .
FREE

We use Price Action and Japanese Candlesticks at important price zones and standard times to open positions and use Risk/Reward: 1/2 - 0.2%/trade. Recommended symbol: EURUSD, GBPUSD, AUDUSD, USDCAD, USDJPY, GBPJPY, EURJPY. Contact me: Gmail: fifund.cuscare@gmail.com, Facebook , Twitter , Instagram . Product: Metatrader4 , Metatrader5 . Broker references: Exness , ICMarket , FBS .
FREE
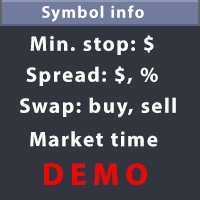
This utility displays the information required for making trades on each opened chart. For example: spread value, swap value; triple swap day; session closing time; ATR of the symbol by Gerchik; total profit/loss for the current symbol; the number of trades made earlier; the percentage change in the quotes of 6 selected instruments; and much more. The spread value is always shown. The rest of the information is displayed depending on the settings: Show total orders at the moment (long, short) .
FREE

Shows various helpful informations lik: ATR (in Pips) Spread (in Pips) Spread in percent of ATR (very helpful when your SL/TP is based on ATR Time left to next candle period Change in percent of last X candles (configurable) Spread warning, when its higher then 1/3 of the ATR Next-candle warning, when it appears shortly (2.5% of period) Please follow me on Twitter https://twitter.com/semager and stay up to date with the newest Indicators and EAs.
FREE

This script allows selecting the TakeProfit and StopLoss levels. It analyzes the history data, and then calculates the probability of reaching a given price level.
How the script works Suppose you have a trading strategy and you want to select the TakeProfit and StopLoss levels. Run the script and set the parameter: Number of Bars - the average position holding time in bars. Once the script operation is complete, the AIS-PPL.csv file will be created in the Files folder in the terminal data cata
FREE

Shows the full name of the symbol on the chart.
Especially relevant for Stocks, CFDs, Indices and Futures.
Also, when you press "right"(cifre 6) on the NumPad, an "Alert" is issued, from which you can copy the name in the "Experts" column
and use, for example, to search for additional information about the company.
In the settings you can select the color, placement and font size.
FREE

The current expert advisor is accomplished as a Telegram-bot. The purpose of the EA is to provide information about any country, event or values retrieved from thу database of the economic calendar . It is necessary to allow the following URL in the options in the tab "Expert Advisors": https://api.telegram.org There's ony 1 input parameter "User name". The Telegram username must be added here as @name. After starting the Expert Advisor onto the chart one needs to open Telegram app and find t
FREE
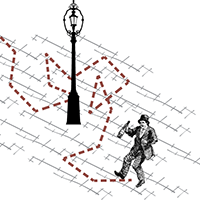
The script simulates a random price walk and saves it to a CSV file.
This file can be used to create charts of random price walk.
How to create custom symbols you can read here .
Script Settings:
SymName - The name of the CSV file that will be saved in MQL5/Files.
HistoryDepth - The number of minutes to simulate a random price walk.
StartFrom - At which price the simulation will start.
VolaCycle - Mode simulates intraday volatility.
The pictures show the recommended settings for a cu
FREE

Script to calculate equity and balance at a specific date and time.
This script makes up for a lack of MetaTrader account history, that does not show how the balance and equity changes in time.
Balance calculation includes closed orders only.
Equity calculation includes orders closed before and orders that are still open at the specified time.
Example: date and time set to 2020/07/06 00:00. If I had a Buy 1 lot EURUSD position opened at price 1.12470 on the 2020/07/02, the program would ca
FREE

Утилита-информер. Показывает количество открытых ордеров по Buy и Sell для текущего торгового инструмента.
Поможет при большом количестве открытых ордеров, что сэкономит силы и время. Теперь нет необходимости считать их вручную. Может стать незаменимым дополнением как для новичков, так и для опытных трейдеров.
Простой скрипт не перегружает систему , можно разместить на всех открытых графиках. +Бонус в комментариях!
FREE

Smart money is a powerful currency. This money is available to major investors who can identify, predict or even generate capital movements ahead of others. This money can flow into financial and capital markets and create dramatic price changes in various stocks. Therefore, detecting smart cash flow, which usually enters the market in a coherent manner and confronts the volume and value of transactions in a market with high returns, is one of the methods that some investors use to invest. But h
FREE

This script calculates the SQN (System Quality Number) value of your account within a time interval that you will set. Keep in mind that trades with no initial stoploss value won't be calculated because of the nature of the system! The calculations will be made on your current account.
What is SQN? Van K. Tharp proposed a formula for System Quality Number (SQN) that measured strategy performance and could be used as a custom objective for optimizing strategy parameters. The formula was present
FREE

The Environment State Info Print is a script to display the constants that describe the current runtime environment of a MQL5 program. General Description
The constants are divided into four groups in the Environment State section of the MQL5 documentation and each group is divided into enumerations/subgroups (with designations “Integer”, “Double” or “String”). The script displays constants in two ways: a single constant or all group constants. The constants are obtained by selecting the
FREE

HelloTrader is a completely new product view for the MetaTrader platform. Immediately after launching, the utility displays randomly one of the lines of the phrase, quotes of famous people or an aphorism in the upper left corner of the terminal. Every 5 minutes the recording changes. The Demo version includes 32 phrases, quotes or aphorisms in English only.
The utility starts working immediately after launch and no longer has any settings or functions. The only task is to randomly display quot
FREE

Presentation The URL html and xml to csv is designed to get contents from URLs with html or xml content, and to download it to an output format as a txt or as a csv file. It enables to get the whole web sites page, starting with the http protocol, in a document for a further use and in additional with downloading directly on the MetaTrader applications and on the desktop. It is a good advantage for taking the most data from events and economic calendars, and also publications related to the inst
FREE

Script to Delete Pending Orders
Sometimes you placed many Pending Orders and then you want delete certain kind of these orders, this script can help you! Usage:
Download and drag and drop this script to the chart. Check "Allow AutoTrading" in "Common" tab and set input parameters in "Inputs" tab. Input Parameters: TypeOfPending: which type Order you would delete. mySymbol: which Symbol you would delete. The input format of the Symbol is such as "EURUSD" or "eurusd".

The script allows to easily watch the date and time of several cities selected by the user from more than 30 important cities all over the world. It also shows GMT, Server time and Local time. The cities on the screen are automatically sorted by the date and time. You can save your setting on the Inputs tab and use them in future. Notice: Daylight saving time is not considered.

Some trading strategies are suitable for the quiet market with less volatility, while others are suitable for the volatile and violent market. Either way, traders should have a clear measure of how hot or cold the market is. This product is convenient for traders to compare the degree of cold heat of different trading varieties, or the trading heat of the same trading variety in different time periods. You can put it on different charts to get the intuition. It's easy to see which is more hot an

Painting Deals on active chart. It allows analyzing trade history on an account to which you have an investor (read only) password. Type of the arrow displayed indicated the deal type: Right Arrow means In and In/Out deals Arrow Left Left means Out deals. Blue arrows are for Buy deals and Red arrows are for Sell deals. The indicator displays deals in the real time mode, it also displays their Stop Loss and Take Profit levels. Put the mouse over the arrows to see the details of deals including op

The script shows statistics of trades for the specified period. For example, if you want to know the details of trades of the ATC2010 Winner ( bobsley ): Login with his account using the investor (read-only) password (MetaTrader5); Open the chart of his trading symbol (EURUSD); Run this script on the chart; Specify 2010.10.1 in "date from", and the diagram will be shown.
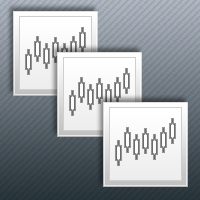
The Synchronized Charts script allows comparing bars of different symbols or different periods of the same symbol. Attach the script to a chart and move bars or change the scale, all opened charts will move synchronously with the current one. The bars on different charts aligned to the border according to their open time. Please be sure the relevant history datas have been downloaded before synchronize charts.

Expert Advisor removes a group of pending orders. Orders are grouped by type. Orders are grouped by entry.
It is possible to form groups arbitrarily directly in the table. Эксперт удаляет группы отложенных ордеров. Ордера группируются по типам. Ордера группируются по направлениям.
Есть возможность формировать группы произвольно непосредственно в таблице.

Expert Advisor to change the Stop Loss and Take Profit levels. It is possible to set stop levels according to the specified profit/loss. You can set the price level directly. Эксперт для изменения уровней Stop Loss и Take Profit открытой позиции. Есть возможность задавать уровни стопов в соответствии с заданной прибылью/убытком. Можно задать непосредственно ценовой уровень ордеров Stop Loss и Take Profit.

The Expert Advisor performs closure of several positions. Positions are grouped by type. You can select the position of largest profit(losses). It is possible to form groups at random. Эксперт выполняет торговые операции группового закрытия позиций. Позиции группируются по типу. Можно выбрать один из трех параметров: filter Off. Buy only. Sell only.
Можно отбирать позиции по величине прибыли(убыткам). filter Off. Wins only. Losses only. и/или задать порог по достигнутой прибыли(убыткам). Есть в

This script allows traders to easily close positions if their profit/loss reaches or exceeds a value specified in pips.
The script allows users to easily close positions if their profit/loss reaches or exceeds a value specified in pips. Please set slippage value first. Sometimes some positions do not close due to high volatility of the market. Please set larger slippage or restart the script.
............................................................................................

Info tool helps to estimate the current risks of open positions and orders. It allows to analyze open positions or/and pending orders, also there are USD/Percentage modes. Expands the margin load and the share of profit participation for individual positions. Информационная панель помогает оценить текущие риски по открытым позициям и ордерам. Есть возможность отдельного анализа рисков по позициям/отложенным ордерам, а также в режимах USD/Percentage. Раскладывает маржинальную нагрузку и долю учас

TimeFilter indicator allows to select visually bit masks (GoodHourOfDay, BadHoursOfDay, GoodDayOfWeek, BadDaysOfWeek), used in the Intraday Time Filter module of the Standard Library. The use of time filters allows to take into account the details of trade sessions. Parameters: GoodHourOfDay Number of the only hour of day (from 0 to 23) when trade signals will be enabled. If the value is -1, the signals will be enabled through the whole day. BadHoursOfDay The bit field. Each bit of this field c

This script notifies a user about different events by playing sounds, sending emails and text messages to a mobile device. The following events are supported: New deals (in/in out/out). Expiration of Pending orders. The terminal disconnected. The terminal or the script closed. Please set a notification type for each event separately. If you need notifications via Email, please make sure that the settings on the Email tab are correct. If you need to receive notifications on a mobile device, pleas

This utility is used to visually choose an indicator for trailing stop and select its parameters. The Expert Advisor modifies the Stop Loss order position opened for the instrument of the current chart based on indicator values. Uses indicators Parabolic SAR , NRTR (Nick Rypock Trailing Reverse) , Moving Average or linear regression channel. The indicators are added to or removed from the chart using the 'show' checkbox.
The following options are available: Parabolic - trailing stop based on th

This script alerts a user via sounds and alert box at the end of a countdown. It is like an alarm clock. There are 2 ways to start counting down: Set a value of remaining minutes. Example: if you need an alert after 1 hour, set it to 60. Set countdown end time. If you like to use a custom sound for the alert, copy your sound files to "terminal_path\Sounds" folder and set the exact file name in the input parameters. The sound file must be in *.wav format.

The Expert Advisor for increasing (or opening) market positions. Allows specifying the desired risk, target and searching for the best open price and trade volume. It is included in the ActivePanel product.
Configurable Parameters:
lots - directly the volume of the position increase. % equity - the amount of growth as a percentage of the amount of funds. stop loss - directly the level of the stop loss order. loss - the level of the stop loss order depending on the allowable loss. take profit -

This product is used to check the foreign exchange market history datas. Good quality historical datas is important for traders to perform market analysis or back testing. But the quality of historical datas provided by various foreign exchange brokers is uneven. Sometimes we notice missing k-line sequences, but sometimes it is not easy to detect them. This product helps users locate these missing locations.If there are many gaps in a given period of time on a chart, you need to be careful about

Informer for VPS - report on the state of your account via e-mail. Useful for controlling your Expert Advisors that run on a VPS or a dedicated computer. Information about open positions and last deals for a day, week, month or year grouped by currency pairs. Adjustable periodicity of reports and depth of deals included in the report. A possibility to add own comment to each report. You will receive reports on e-mail with specified periodicity: from 15 minutes to once a day. The reports are sen

.................................. This script is intended to help users to get information about ticks and spreads (e.g. ticks count, minimum/maximum/average spread). It can export reports in the CSV format with this information. Traders can see spread statistics in real time in the chart window It is useful for comparing spreads of different brokers. --------------------------------------------------------------------------

This is visualization tool based on the Depth of Market. It works with the symbols that have the Depth of Market available. It's a visual indicator that shows the volume of each Bid/Ask price and ratio of total volume of Bids/Asks. Note: check if your broker supports DOM before purchasing.
。。。。。。。。。。。。。。。。。。。。。。。。。。。。。。。。。。。。。。。。。。。。。。。。。。。 。。。。。。。。。。。。。。。。。。。。。。。。。。。。。。。。。。。。。。。。。。。。。。。。。。。

This is an Expert Advisor that allows opening and modifying positions and orders via mouse (with Stop Loss, Take Profit). Working with this Expert Advisor requires setting lot size, take profit and stop loss for positions. For pending orders you need to set lot size, take profit, stop loss and distance (pip). This Expert Advisor has only one input parameter - background color.

A script for closing positions If you need to quickly close several positions, but it requires specifying maximal deviation and the number of attempt to close, this script will do all the routine for you! Allow AutoTrading before running the script. Usage:
Run the script on a chart. Input Parameters: Language of messages displayed (EN, RU, DE, FR, ES) - language of the output messages (English, Russian, German, French, Spanish). Slippage - acceptable slippage when closing. Specified as for 4-di

Script for deleting pending orders If you need to delete all pending orders you placed, this script will do it for you! Allow AutoTrading before running the script. Usage:
Run the script on a chart. Input parameters: Language of messages displayed (EN, RU, DE, FR, ES) - language of messages displayed (English, Russian, German, French, Spanish). Use Magic: (0 - ignore Magic, else - only this Magic) - if set to zero, the magic number is not considered. Otherwise the script deletes only orders wit

A script for opening a grid of orders If you need to quickly open several pending orders (Buy Limit, Sell Limit, Buy Stop, Sell Stop) on a certain distance from the current price, this script will do all the routine for you! Allow AutoTrading before running the script. Usage:
Run the script on a chart. Input Parameters: Language of messages displayed (EN, RU, DE, FR, ES) - language of the output messages (English, Russian, German, French, Spanish). Price for open - open price. If set to 0, the

A script for quick reversing positions and/or orders. If you need to reverse a position with the same volume, open an opposite position of a different volume or change the type of existing orders (for example, Buy Limit -> Sell Limit, Buy Stop -> Sell Limit, etc.) with the same or different take profit/stop loss, this script will make all the routine for you! Allow AutoTrading before running the script. Usage: Run the script on a chart. Input Parameters: Language of messages displayed (EN, RU, D

Good day, ladies and gentlemen. What I offer is a pane that allows trading in any direction with a single mouse click, as well as setting stop loss and take profit automatically without your interference according to predefined values (this function can be disabled). The pane is implemented as an Expert Advisor, the buttons are located on the right part of the chart. The pane will be useful for scalpers that trade with different risk level and for intraday traders. The pane has been tested on li

CloseByLossOrProfitTune Expert Advisor closes a part of position as the total profit or loss for specified symbols reaches a specific value. The profit or loss level is specified in the deposit currency. In addition, the Expert Advisor can delete pending orders. Allow AutoTrading before running the Expert Advisor. Usage: Run the Expert Advisor on a chart. Input Parameters: Language of messages displayed (EN, RU, DE, FR, ES) - language of the output messages (English, Russian, German, French, Spa

The CloseByPercentLossOrProfit Expert Advisor closes some positions as the total profit of loss for the entire account reaches a specified value. The profit or loss is specified as percentage of the account balance. In addition, the Expert Advisor can delete the pending orders. Allow AutoTrading before running the Expert Advisor. Instructions: Run the Expert Advisor on the chart. Input parameters: Language of messages displayed (EN, RU, DE, FR, ES) - the language of output messages (English, Rus
The script is designed to analyze deals history of a signal exported to a csv-file from its page. The exported file of the studied signal must be placed in the terminal data folder\MQL5\FILES\. The script displays deals for the current chart symbol to which it is applied. In a separate window a short trading report will be created either on the current symbol deals, or on all the deals. There is a possibility to save the report in an htm-file (Shift+H). The script parameters: signal csv-file nam

The script displays the following information: Maximum possible lot for a Buy or Sell deal at the moment; Daily, weekly, monthly and yearly profit; Maximal and minimal lot allowed by dealer; Account type (real, demo); The number of open positions and orders. Swap (long and shoet), текущий инструмент, текущее плечо, уровень Stop (stop level). Tick value and Pip value.

Another script for opening orders and positions that features the possibility to set a comment and a magic number. Parameters: Magic - magic number. Comment - comment for an order or position. OrdType - type of the order or position (Buy, Sell, BuyLimit, SellLimit, BuyStop, SellStop, BuyStopLimit, SellStopLimit). Lot - request volume of the order. Price - price at which the order should be executed. LimitPrice - price that will be used for a Stop Limit order. SL - Stop Loss price (loss control

Overview The Expert Advisor sends notifications to a mobile phone, via e-mail or activates an audio alarm in case any changes are detected on the trading account: opening/closing positions, changing order and position parameters, balance or leverage. Also, the Expert Advisor can inform that Equity on the trading account has dropped below a specified value or Free Margin is small compared to Margin. The Expert Advisor does not trade, it only monitors your account and orders.
Launching the Expert

Overview The script displays information about the trade account and the current financial instrument. Information about the trade account: Account - account number and type (Real, Contest or Demo); Name - name of the account owner; Company - name of a company that provide the access to trading; Server - trade server name; Connection State - connection state; Trade Allowed - shows whether trading is allowed on the account at the moment; Experts Allowed - shows whether it is allowed to trade usin

Introducing a compact and handy panel that shows the main parameter of the current price on a chart. The following information is displayed: The price value itself, a user can choose Bid, Ask or Last; Instrument name ; Type of the price displayed; Spread size in pips; Stops level in pips; Change of price in pips comparing to the day start; Current daily range ( High - Low ) in pips; Average daily range in pips for the last 20 days. External parameters: Instrument Name - name of the instrument to

Introducing a compact and handy panel for watching the market and estimating multicurrency price movements. It shows main parameters for a user defined group of symbols in the form of a table. Its functionality is checked on Forex and FORTS. The following information is displayed: Financial instrument name . Last price value - can be turned off for off-exchange markets. Ask price value . Bid price value . Spread size in pips. Stop level in pips - can be turned off for off-exchange markets. Chang

The Expert Advisor notifies that a price has crossed a line on the chart. It handles two types of lines - horizontal lines and a trendline. The number of lines is unlimited. It can also notify of changes in the margin level, in the total volume and profit (loss) for a symbol.
Parameters: price mode - price type (bid or ask). timeout - alert timeout. number of repeats - the maximum number of repeated alerts. comment lines - the number of lines in a comment. email - enable sending of Email notifi
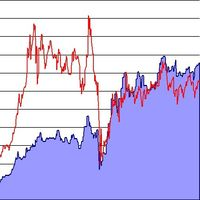
This script analyzes all symbols in Market Watch for a set timeframe. The result is displayed on the Experts tab and in the specified file. For more convenient viewing and editing, the result is displayed in a csv file. For the calculation, the Pearson formula is used. The value of the correlation coefficient of pairs close to 1 means that the pairs move almost identically. A value close to -1 means that the pairs move in the same way. This tool will be useful to those who use hedging due to the
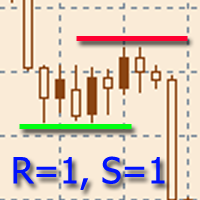
The indicator is designed to build horizontal support and resistance levels. The level search algorithm is based on the grouping of extremes. It is possible to display statistical information for each level, filter the display of levels by a number of properties, adjust the color scheme depending on the type of level (support or resistance). Features:
The indicator is ready to work and in most cases does not require special settings Manual or automatic selection of the range of extrema grouping

This script allows you to compare quotes and spreads from different trading servers or brokers to identify a server/broker that offers the best bid/ask price and the tightest spread. It can be compared with up to six different servers or brokers at a time, and it is easy to find the best quote provider by score. Usage: Open up to 6 MetaTrader client terminals, login to different servers/brokers, and then start the script on each terminal's chart.

AutoCloseTimer allows you to close positions and delete pending orders at a specified time.
Usage Download and drag and drop AutoCloseTimer onto the chart. Check Allow AutoTrading in Common tab. Set parameters in Inputs tab. Notice: The close time must be later than the current market time.
Input Parameters CloseSymbol - there are 2 options SymBol Of Chart - just close the symbol of the current chart
All Symbols - close all symbols CloseTimerDay - specify a day for AutoCloseTimer. The default

Auto Trade Driver is an automatic powerful tool (run as Expert Advisor) that helps you to manage risk and control orders and maximize your profit in multi-protect/trailing-stop rules. This tool is very useful for both scalpers and trend followers. It not only calculates the trade risk exactly, but also protects and maximizes your profits in real-time. With this tool, the only thing you have to do is to enter trade by your own strategy, then it will auto-drive your position with exit strategy you
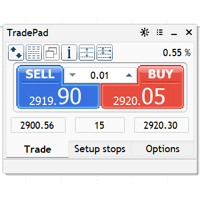
TradePad is a tool for both manual and algorithmic trading. We present you a simple solution for fast trading operations and control of positions on several trading instruments. The application interface is adapted for high-resolution monitors, simple and intuitive. For comfortable work, the trader is offered the following set of tools: A hot key manager for managing trading operations, switching between periods of the main chart, switching between TradePad instruments; A tool for marking tradi

My Money Manager like a risk controller, which places your trades with the exact volume that meets your desired stop loss risk percentage. It can also help you to preview your EP/SL/TP levels before placing an order by dragging these levels directly on a chart, and keep reporting about them during the position opening. With this tool, you will feel more comfortable when deciding to open orders, as well as forecasting your profit/loss with your orders. Placing orders is a very precise and profess
Do you know why the MetaTrader Market is the best place to sell trading strategies and technical indicators? No need for advertising or software protection, no payment troubles. Everything is provided in the MetaTrader Market.
You are missing trading opportunities:
- Free trading apps
- Over 8,000 signals for copying
- Economic news for exploring financial markets
Registration
Log in
If you do not have an account, please register
Allow the use of cookies to log in to the MQL5.com website.
Please enable the necessary setting in your browser, otherwise you will not be able to log in.