Watch the Market tutorial videos on YouTube
How to buy а trading robot or an indicator
Run your EA on
virtual hosting
virtual hosting
Test аn indicator/trading robot before buying
Want to earn in the Market?
How to present a product for a sell-through
Paid Expert Advisors and Indicators for MetaTrader 5 - 57
Easily convert your candlestick patterns into signals!
Eval - Command interpreter - Command line interface - String converter - Customizable sign I bring one more indicator that was requested by a real trader. Thanks for the suggestion mate!
The String2Signal indicator will allow you to write your candlestick patterns and get the signals on the screen, integrating with EAs or using it to assist in manual operations. You type a text with your setup and the indicator converts it into the MQ
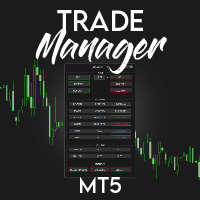
️ Discover the powerful Trade Manager for MetaTrader, a tool that will revolutionize your trading experience in the financial market. This innovative software provides you with efficiency and speed, allowing you to execute all your trades quickly and visually.
️ With just a click of a button, the Trade Manager creates three strategic lines: a blue line for order placement, a green line for take profit, and a red line for stop loss. These lines offer you a clear focus and enable you to manag

Range Break Scalper is a forex robot designed to trade breakouts of predefined price ranges. The robot has several input parameters including Auto Lot Size, Max Auto Lots, Risk % of the account, Lot size, SL in range percentage, Target in range percentage, Allow Trailing stop, Trailing points, Range start time(Hours), Range start time(Minutes), Range duration(Hours), Range duration(Minutes), Range close time(Hours) and Range close time(Minutes). The Auto Lot Size parameter allows users to choos

This long-term trading system works on 3 pairs and on the H1 timeframe. It uses various trading systems such as trend trading, countertrend trading and a few others. This increases the chances of sustain
MT4 Version: https://www.mql5.com/en/market/product/90740 Signal of Gambit: https://www.mql5.com/en/signals/1800861
INPUTS FOR GAMBIT
Comment for positions: Enter your comment for orders here Magic number: magic number for orders Lots method: lot management method manual lots: use

Diamond by MMD
Diamond by MMD is an advanced indicator that identifies places that are important for price behavior. This indicator - on any timeframe - detects and marks price reaction zones on the chart. Diamonds - one of the elements of the knowledge pyramid in the MMD methodology - are candles that meet very strict conditions. There are two main types of diamonds: - standard diamond, - reversed dementia. Both of these models are automatically identified and marked on the chart. The indica

This Robot detects when an statististical anomaly is present on the market an exploits its. It works better on currencies with low volatility but it performs relativellly well on high volatility pairs like EUR/USD and with indexes and commodities. Uses some indicators and its statistical properties to perform statistical arbitrage. Maximal drawdown 22%.(Backtesting) Instructions The bot needs 3 parameters to work: - Sigma (float) : size of the anomaly. A larger sigma means that the anomaly that
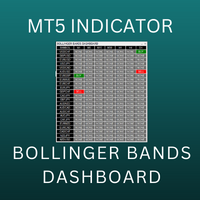
Bollinger Bands Multi Dashboard MT5 uses the value of Bollinger Bands indicator. This dashboard will monitor all symbols in the market watch. We can set up to receive an alert, notification or an email when the buy/sell signal appear on each timeframe. You can check all symbols via only 1 chart. This dashboard will check almost popular time frame (M1,M2,M3,M4,M5,M6,M10,M12,M15,M20,,M30,H1,H2,H3,H4,H6,H8,H12 and D1) in MT5. The colors can be customized. We can have a look at many pairs and many t
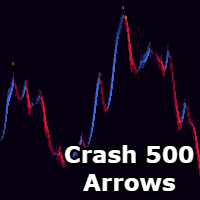
Sylvan Crash 500 Arrows!! MT5
*Only use this on Crash 500 Market. *Only for the 15M Chart. *Sells only. *This doesnt redraw or repaint but the candle needs to close for the arrow to print permanently, it does print on candle open. *It doesnt get you at the tip of highs but instead as soon as price slows down or drops from its overbought parameters. *Do not change input settings as this is already optimized.

To download MT4 version please click here . - This is the exact conversion from TradingView: "Trend Direction Force Index - TDFI [wm]" By "causecelebre". - This indicator uses multiple levels of averaging to detect trend strength. - You can optimize filter low and filter high levels to achieve best results. - You have access to buffers to use in EAs. - This is a light-load processing and non-repaint indicator. - You can message in private chat for further changes you need.
Советник основан на популярной стратегии и использованием связки из двух индикаторов: Bollinger Bands + RSI. Добавлена функция добавления новых позиций при определенной просадке. Количество добавляемых позиций и размер просадки регулируются. Описание настроек Группа "Настройки торговли" Lot Size
Размер лота
Drawdown
Просадка
TakeProfit
Тейк профит
Count
Счетчик доливок (не более 10)
New bar control Включение явного контроля открытия нового бара (для тестера) Группа "Настройки Bol

Time Line by MMD is a simple indicator that supports historical data analysis and trading on statistical models that follow the MMD methodology.
Start Time - specifying the time when we start analyzing and playing the MMD statistical model Time Duration in minutes - duration of the model and its highest effectiveness (after the end of the line, the price returns - statistically - to the set level) Lookback days - the number of days back, subjected to historical analysis Base Time Frame - the
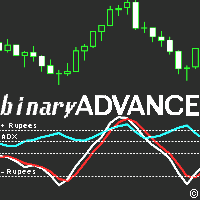
Update 2.2: Added MFI with predictive mod. Updated all indicators to reflect similar values, to combine multiple ones to rest well on overbought/oversold lines.
Update 2.3: Minor bug fixes.
Update 2.4: Removed buggy indicators DeMarker, and MACD, as it was too complicated and not as accurate as the rest due to it's nature. Added Awesome Oscillator. removed spreads, as it bogged the indicator down. Added other features, like indicator value compensators to match each other's levels when combine

Советник основан на классической трендовой стратегии "Моментум Элдера" Дополнительные возможности: Фильтр важных новостей Режим невидимки Возможность торговать по тренду Фильтр ложных пересечений сигнальной линии Моментума Отправка уведомлений в мобильный терминал о событиях Регулировка стандартной зеленой зоны (100 пунктов) и отрисовка её на графике Описание настроек: Группа "Настройки торговли" Lot
Размер лота
Profit-to-loss ratio
Отношение возможной прибыли к возможному убытку
Use ste

Unleash the Power of Trading with the Boss Key Levels Indicator!
Are you ready to conquer the markets and elevate your trading prowess to extraordinary heights? Look no further! The Boss Key Levels Indicator is your secret weapon, designed to revolutionize the way you approach the financial markets and supercharge your trading strategy.
Harness the potential of Key Levels, those pivotal price zones that hold the key to market movements. With the Boss Key Levels Indicator, you gain acce
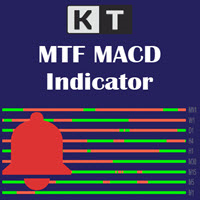
As a trader, monitoring multiple timeframes simultaneously will help you better understand the trend and know when multiple timeframes are in agreement or disagreement. The KT Multiple Time Frame (MTF) MACD displays the overall direction of an instrument in one chart by showing the moving average convergence divergence (MACD) for all time frames. The indicator displays a simple table with the respective MACD trend for each timeframe. You can also see whether MACD is gaining or losing momentum ac

It is important to read and understand the EA. Optimize for parameters. The EA does use stops and does not use martingales This is an original partial concept version, not the same but a concept of HFT HACKER: https://www.mql5.com/en/market/product/74421 HFT HACKER uses money management and is not so much about getting 1 pip and was built with machine learning. This EA will buy and sell capturing small moves. It needs to be trades on the best broker for small moves, like a direct access
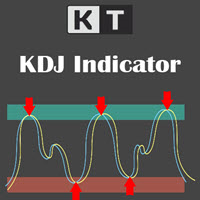
Basic technical analysis tools use signals during market changes by providing critical information that can influence investment and trading decisions. Several technical analysis tools are developed for this purpose, and one of the most popular indicators traders use the KDJ Random index. It's known as the Random Index, is primarily a trend-following indicator that aids traders in identifying trends and prime entry points.
Features
It analyzes and projects changes in trends and price patte
The Schaff Trend Cycle (STC) is a technical analysis tool that helps traders and investors plot highly-probable predictions on the price direction of an instrument. Due to its predictive properties, It's a good tool for foreign exchange (forex) traders to plot buy and sell signals. The Schaff Trend Cycle was developed by prominent forex trader and analyst Doug Schaff in 1999. The idea driving the STC is the proven narrative that market trends rise or fall in cyclical patterns across all time fr

Follow The Trend EA is a long-term EA that uses the Advanced Breakout strategy in determining pending order positions. This strategy has been proven safe and stable. Follow The Trend EA based on the backtest that we tested for 5 years produces the following data: Risk : Reward = 1:2
Consecutive Wins = 11x
Consecutive Loss = 17x
Maximal Drawdown = 11.75%
Profit Factor = 1.36
Requirements and Recommendations Follow The Trend EA specifically for the USDJPY pair on the H1 timeframe.
Take control of the most important candle on your chart. Customise and supercharge the active candle. "LastCandle" is a unique indicator. There is no other indicator that is so laser-focused on just the active candle. Set different colors and make it stand out from all the other candles. (This makes sure you never mistake an active candle from a closed one. Even if this happens once it could save you the cost of the software.) When you zoom out, you get a super-sized version of the candle so yo

The construction of a breakdown system includes the following steps: 1. Determination of the current volatility and the breakdown threshold. The current volatility, in this case, is defined as the difference between yesterday's daily high and the daily low. The breakdown threshold is set at 70-75% of this value. 2. Setting pending buy and sell orders. 3. Entering into a transaction, placing stop loss and take profit orders. Breakouts occur, as a rule, during periods of consolidation. As can be s

The double top bottom pattern is arguably one of the technical analysis's most popular chart patterns. These patterns are used to capitalize on recurring patterns and identify trend reversal patterns, thereby creating well-placed entry and exit levels. The KT Double Top Bottom is based on these patterns and fine-tunes the trade signal development process for traders.
Features
It's based on one of the most reliable trading patterns and brings some fine-tuning and automation to the process. A

KT Forex Super Scalper is created to identify market trends and plot trade signals based on the direction of the predetermined trend. It functions very similarly to moving averages but reacts quickly to changes in price actions and can signal right away once a valid trend is confirmed. The quick reactionary feature makes it a valuable tool for scalpers. However, anyone familiar with moving averages can use it for actual trading because of its signaling process and chart demonstration simplicity

The KT Market Speed is a unique and straightforward oscillator-based technical analysis tool that helps traders visualize the speed at which the price of an instrument changes based on the preset length. The Market Speed representation helps correctly map the price momentum: is it moving fast, slowing down, or trapped in a range? These are the questions the indicator answers, giving traders more bandwidth to execute better-informed trade positions.
Formula
It's a simple technical analysis t

KT Forex Line can be described as an improved version of the moving average indicator. The indicator is embedded in the main trading chart and features a line that switches between blue and white depending on the prevailing direction or mood of the market.
Utilizing the indicator is simple. You do not need to understand complex graphs and intricate lines. Recognize the indicator line's color and trade accordingly.
Key Features
The indicator has customizable colors, with the blue and red b
Unlike many other programs on the mql5 market, this is a REAL trading strategy. It does not use any martingale or grid functionality and follows a logical concept.
The Range Break Expert Advisor can be used to trade time ranges. The market often finds its direction in the morning and then follows this trend throughout the day. This expert advisor is designed to trade these trends after the breakout of the range set up. Still, you can trade all kinds of time breaks with this program.
I have
Bohr breakout scalper is a fully automated robot based on a wave breakout strategy. It is not a simple robot that just add pending orders at the extrem price, but a robot that dynamically adjusts it's trading strategy according to market price trends.This robot integrates a variety of wave trading strategies,enabling the robot to quickly make trading operations at the right price.Reliable risk filtering systems can filter out high-risk orders in a timely manner,and efficient algorithms can quic

Selling at 30$ for one week! The Obie Scalper Alerts indicator for MT5 is an excellent buy/sell rapid signals tool for scalpers and day traders alike. The signals are very easy to understand and they appear in the main chart window as blue and red colored dots. Buy & sell signal:
A blue dot is a buy signal. A red dot is a sell signal. Feel free to experiment with the indicator’s different settings and input values. The indicator works equally well on all currency pairs (majors, minors and exo

KT Trend Exhaustion is our personal implementation of the famous Trend Exhaustion Index developed by Clifford L. Creel, Ph.D., in 1991.
The change in price direction often comes with uncertainty. TEI helps to tackle the uncertainty by showing a crisp direction using the smoothed color-changing index.
Features
Easy to use and interpret. It comes with a multi-timeframe scanner that scans the upcoming signals across all the time-frames. It can be used as an entry signal or trend confirmation

Have you thought about sharing your EA trading signals with your friends? Or your EA signal can trade cryptocurrencies, but it cannot trade Binance Futures directly in MT5? Or you have an excellent EA, but it cannot be applied to other quantitative trading platforms without source code? Hook EA is to solve these problems. Regardless of whether you trade with a real account or a Demo account, Hook EA can monitor the Order or Deal submitted by any EA in real time, and send the information to the
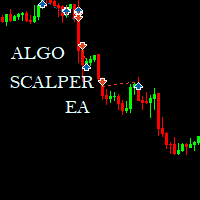
Algo Scalper EA is a confluence day trading robot using market orders and it trades during Trading Sessions. The EA exercise consistency and risk management, it has 2 entry signals produced from Moving Averages(90 & 120) to harvest the most out of the trending market (on automatic mode). It is capable of allowing you to trade any symbol you want and during the time you want. Profits can only be secured by take profit level. Low spread is highly recommended for this EA, and you will see signific
Broken Scapling is a breakthrough scalping strategy, through long-term support pressure breakthrough transactions, avoid too many false breakthroughs, thereby increasing the winning rate. The Broken Scapling strategy will automatically judge the current support pressure level. At the same time, there are three built-in fund management methods, including: fixed lot size, martingale lot size management (after the last stop loss, the next time the corresponding lot size will be automatically incre

CoioteOscilator é um rastreador de tendência e padrões de estruturas gráficas. O Indicador é composto de 3 elementos. oscilador principal lento: histograma com nível de 0 até 50 e 4 cores, 2 compradoras, de 0 até 30 e acima de 30 e duas vendedoras, de 0 até 30 e acima de 30. oscilador principal rápido: linha magenta com nível de -50 até 50. gatilho: linha amarela com nível de -50 até 50. O oscilador principal lento é um rastreador de tendência primaria.
O oscilador principal rápido é

What Is Market Imbalance? Market Imbalance, also known as "IPA" or Improper Price Action, is when price moves so quick in one direction with no orders on the other side of the market to mitigate the price movement. We all know Big Banks, or "Smart Money", can move the market by placing huge orders which in turn can move price significantly. They can do this because Big Banks are the top 10 Forex traders in the world . But unfortunately, the Big Banks cannot leave these orders in drawdown and mu

MT4 Version : https://www.mql5.com/en/market/product/90165 MT5 Version : https://www.mql5.com/en/market/product/90469 The "Dynamite Breakout" Expert Advisor (EA) is a sophisticated trading algorithm designed to capitalize on the explosive price movements that occur during breakout scenarios in the forex market. Leveraging a unique blend of currency strength measurement and hedging risk management, this EA aims to maximize profitability while minimizing risk. Key Features 1. Currency Strength
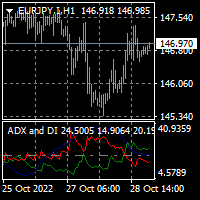
To download MT4 version please click here . This is the exact conversion from TradingView indicator: "ADX and DI" By " BeikabuOyaji". This is probably the most popular implementation of Average Directional Index available. This indicator lets you read the buffers as below: index 0: DIPlusBuffer ==> Green Line by default index 1: DIMinusBuffer ==> Red Line by default index 2: ADXBuffer ==> Navy Line by default - You can message in private chat for further changes you need. Note: This is a non-rep
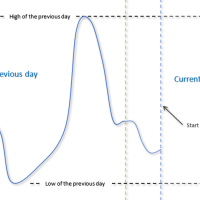
This Expert Advisor belongs to the class of utilities for manual and semi-automatic trading. The " Pending order at the extremums of the day " EA places two pending orders at the extremums of the previous day. Parameter " Pending Orders: ... " allows you to select the type of pending orders: " Buy Stop and Sell Stop " or " Buy Limit and Sell Limit " . extremum 'Low' offset is made downwards). " New pending -> delete previous ones " set to " true " will f
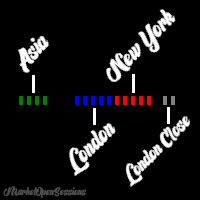
MarketOpenSessions is an indicator helps as a visual clue for which market session is at the time being. If you consider killzone, market open/close as important factor, this indicator would help you reduce effort in converting from one time zone to another. It has the following features 2 display styles: section (as colored line), and histogram 4 major configurable market sessions i.e. Asia, London, New York, and London-Close session. In additional to end of trading session of the day. Female s

The HL-Plus Expert Advisor has many settings for trading, the ability to trade one lot or a set of orders on a grid, the ability to work with a loop of orders, it is possible to increase the number of orders according to a given algorithm, as well as reduce the number of orders based on accumulated profit, there is also a functionality Expert Advisor settings for trading on a given trend. https://www.mql5.com/ru/signals/1749787?source=Site +Signals+My

All about Smart Money Concepts Strategy: Market struture: internal or swing BOS, CHoCH; Orderblock; Liquity equal; Fair Value Gap with Consequent encroachment, Balanced price range; Level with Previous month, week, day level or in day level (PMH, PWH, PDH, HOD); BuySell Stops Liquidity (BSL, SSL); Liquidity Void Long Wicks; Premium and Discount; Candle pattern ... "Smart Money Concepts" ( SMC ) is a fairly new yet widely used term amongst price action traders looking to more accurately navigate

100 % PER MONTH PROFIT---- MY NEW SIGNAL HERE -------> https://www.mql5.com/en/signals/2162238?source=Site+Signals+My#
The Commodity Channel Index (CCI) measures the current price level relative to an average price level over a given period of time. CCI is relatively high when prices are far above their average. CCI is relatively low when prices are far below their average. Using this method, CCI can be used to identify overbought and oversold levels.
You can set the period of CCI.
The i
Советник для, перевода позиции в безубыток + трал. Сделан специально для работы на Мосбиржи с учётом удаления позиции при клиринге и последующем её открытии по новой цене. После клиринга, советник тралит учитывая реальную цену открытия позиции, а не ту которая получилась после клиринга. Советник может работать на любых рынках. На счетах HEDGING советник будет переводить в БУ и тралить каждую позицию, отдельно.
Так как демо версию советника можно запустить только в тестере стратегий , а этот

Trading strategy: Scalping by price speed. The Expert Advisor is based on a complex trading system based on high price fluctuations. The essence of the strategy is that the expert determines high price fluctuations on the chart using complex mathematical calculations and then, if there are good moments to enter the market, the adviser opens pending orders. The EA uses BuyStop and SellStop pending orders. Trading is conducted on the H1 timeframe. The EA does not use Martingale, Grid and other str

Do You Like Catching 100+, 500+ Pips In Seconds, Trading During High Impact News Like NFP, and CPI..?
I have been trading news for 2 year with my mentor Raja Banks, playing the Buy Stop, Sell Stop pending orders.
In normal news events price shots straight-down or straight-up based on the data of the event, and sometimes it whipsaws up and down.
As a manual trader, somedays I would miss out on securing big profits because price moved too quick, and retraced back to hit my Stop Loss, or eve

This Renko is: Live : constantly updated on the market prices Dynamic : updating on each new ATR value Backtestable : Generating the chart during backtest, allowing Real Ticks Accuracy and Time Period Accuracy Guppy Built-in : GMMA with 12 EMA built-in This is what you are looking for! RENKO A Renko chart is a type of chart, developed by the Japanese, that is built using price movement rather than both price and standardized time intervals like most charts are. It is thought to be named a

Multiple Timeframe MACD indicator. This indicator was built for making multiple timeframe analysis possible in MT5 using MACD Indicator. MACD Indicator traditionally shows two lines and one histogram. MACD Line(Yellow) is calculated by subtracting 12period EMA(fast) from 26period EMA (slow). Signal Line(Blue) is created by a 9period EMA from MACD Line. Histogram is just the difference between MACD and Signal lines. Histogram is colored based on the difference between its value and the previous h
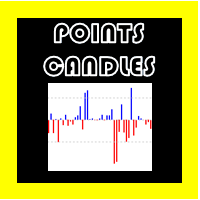
POINTS CANDLES OSW
(METATRADER 5)
With this indicator you can know the size in points of each of the candles that are being handled in the chart, giving you information about the size and direction of each one, the indicator will point up if it is bullish and down if it is bearish. In addition, you can also hide or show all the candles, only the bullish ones or only the bearish ones, this is for brokers that manage assets that give stronger candles in one direction like Deriv, if your broke

A Média Móvel é um indicador que faz parte da Análise Técnica. Com ela, é possível identificar o equilíbrio dos preços no mercado, observando tendências de alta, neutra ou baixa. Este indicador customizado traz opções extras pera definir o método de cálculo podendo-se esclolher entre SMA,EMA,SSMA,LWMA,JJMA,JurX,ParMA,T3,Vidya,AMA,HULL MA. Também conta com varias opções para escolher o método de cálculo para o preço base a ser usado no cáculo da média.

Keltner Channels (ou Canais de Keltner ) é mais um indicador de volatilidade utilizado pela análise técnica. Também chamado de envelope , esse canal foi criado por Chester Keltner para monitorar os seus investimentos no mercado futuro de café na década de 1960. Porém, com o passar do tempo, passou também a ser utilizado para outros ativos e, atualmente, é uma das ferramentas mais utilizadas pelos traders. Nesta versão customizada foram adicionados novas opções de método de média movel
Volatilities Scalper is an EA based on the High/Lows of a Candle, it uses lots of indicators to get an accurate entry, Hedges if the price was on opposite direction. See the Parameters Below and please dont use the default settings. Feel free to optimized also so you can see its capabilities on the live market. For Volatility Index 75 Use the settings Below :
Autolots :0.0000001 SL : Optional TP : Optional Close All in Pips : 500000 ( it will close all the trades No Matter How on the Desired
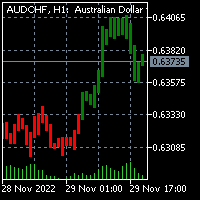
To download the MT4 version of Donchian Candles please click here . You may also check this link . This is inspired by TradingView: "Donchian Trend Ribbon" By "LonesomeTheBlue". This indicator merges Ribbon data into chart Candles. The result is one of the coolest indicators out there to detect trend direction and strength. As a trader you always need such indicator to avoid getting chopped in range markets. - You can message in private chat for further changes you need. The indicator is l

Watch permanently the strength of all majors! The strength is shown through horizontal bars in the top left corner. Additionally you get a recommendetation which pair is currently the strongest/weakest and should therefore be bought or sold. Simple and easy! I use this indicator in my own expert advisor - but I will probably NOT publish this expert advisor! Sorry guys!

Blow Stopper EA V3 Introducing Blow Stopper EA V3 , the groundbreaking Mql5 utility's (expect advisor) that's transforming the way you trade the EURUSD, NZDUSD, AUDUSD, EURJPY, GBPUSD, USDJPY, USDCHF, USDCAD, EURCHF and XAUUSD (GOLD) pairs! Developed and compiled by Tsietsi Gladson Nyathi.
***Blow Stopper EA uses 7 Ichimoku Setups for it to enter a position, all 7 should agree on 1 thing which is either buy or sell before it opens a position and it doesn't have a Tp because it uses trailin

What is the Volume Weighted Average Price (VWAP)? The volume weighted average price (VWAP) is a trading benchmark used by traders that gives the average price an instrument has traded at throughout the day, based on both volume and price. It is important because it provides traders with insight into both the trend and value of the instrument.
What is the Difference between VWAP and AVWAP? While VWAP is having as starting point the beggining of the day,week,month etc. in the AVWAP you can p

This EA opens a buy sell order based on the H4 trend and Candle Sticks. When the price goes over 100 pips ea keep opening orders against the price until the profit is positive and EA will close all orders and continue the new round. Requirement - Flatform: MT5 - Symbol: XAUUSD. - Time frame: M15 - Minimum deposit: >1000$ - Leverage: 1:500 and higher - ECN broker - Virtual Private Server hosting (VPS)

Утилита Trade By Time предназначена для автоматизации торговли для списка валютных пар в определённое время, например, во время выхода новостей. Принцип работы будет описан немного ниже. Сама утилита работает только с заранее подготовленным файлом с таймингом и списком инструментов. Сам файл нужно положить в каталоге данных в папку Files , указать название этого файла в настройках утилиты и перезапустить её. Файл должен содержать строки с данными следующей структуры: yyyy.mm.dd hh:mm; <EURUSD|
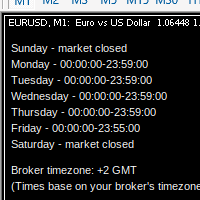
MarketSchedule displays market sessions' open/close time for each day through out the week, also broker's timezone.
It also supports instruments that have more than 1 session per day (maximum of 2 as most instruments don't have more than this)
e.g. crypto market such as BTCUSD which usually has a few hours break mid-day thus it spans into 2 market sessions. You don't have to spend time looking for such information on broker's website. It's an on-demand script that you can drop onto the chart t

Get it for less than $99 while you can! Will be increased to $300 very shortly after a few downloads!!
Set files provided in the comments. Please follow my Telegram and Discord as more set files are released every couple of days.
Join my Discord and Telegram Channel - Max's Strategy For any assistance and help please send me a message here. https://t.me/Maxs_Strategy https://discord.gg/yysxRUJT This EA does not use any martingale and/or grid functionalities. Send me a message if you need

The Quantitative Qualitative Estimation (QQE) indicator is derived from Wilder’s famous Relative Strength Index (RSI). In essence, the QQE is a heavily smoothed RSI.
Modification of this version: ( converted from tradingview script by Mihkell00, original from Glaz)
So there are Two QQEs. One that is shown on the chart as columns, and the other "hidden" in the background which also has a 50 MA bollinger band acting as a zero line.
When both of them agree - you get a blue or a red bar.
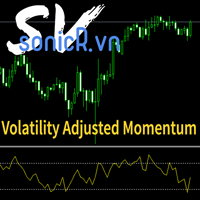
It's a indicators that computes volatility-adjusted momentum. The problem with the momentum indicator is that it's absolute and it's hard to interpret its value. For example, if you'll change the timeframe or instrument value of Momentum will be very different. We tried to solve that by expressing momentum in volatility . This way you can easier spot overbought/oversold values. You can choose to use Standard Deviation or ATR for adjustments. Our method is base on Momentum and the Cross-secti

! IMPORTANT ! To ensure that the backtest runs without errors, the following must be set in the settings: Limit Time Range: Timerange = True must be selected. The time must be set so that the EA does not trade during the rollover of your broker. Exit at End of Range is not relevant and can be set to either true or false!
The "The Real Supertrend EA" shows in the backtest a stable increase of the equity from 2016 until today.
Yearly over 50% in the USDJPY. This is not a guarantee of winning!
With correctly identifying the " Order Blocks " we can estimate the approximate location of price exhaustion. These are locations which the big players place their orders. We gathered this data by our experience and years of hard work and put it into this EA This is important that our EA is NOT martingale and have a very good TP/SL ratio and each order will have a hard SL and TP it can trade on many symbols but recommended ones are already as default
Symbols that expert trade best
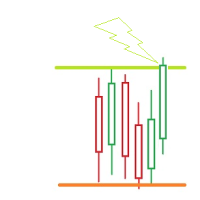
- simple PRICE Action Indicator/ Tool - SELF-Adjusting - you choose the UPPER Border of your RANGE ( Resistance) - you choose the LOWER Border of your RANGE ( Support) # Alert happens when the PRICE CLOSES above/below 1 of these Borders # (we released a TOUCH - Version too) - popup Alert or custom sound - PUSH notification - eMAIL notification - once a Border got crossed(closed candle! )--> it doesnt disappear --> it goes a selectable amount of POINTS ( RANGE(new) ) above/below t
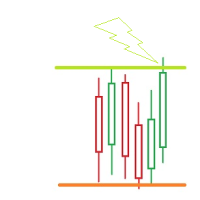
- simple PRICE Action Indicator/ Tool - SELF-Adjusting - you choose the UPPER Border of your RANGE ( Resistance) - you choose the LOWER Border of your RANGE ( Support) # Alert happens when the PRICE TOUCHes 1 of these Borders # (we release a CLOSED above/below - Version too) - popup Alert or custom sound - PUSH notification ( no email - that tool is for quicker action) - once a Border got hit --> it doesnt disappear --> it goes a selectable amount of POINTS ( RANGE(new) ) above/b

Binance Grid Pro offers an alternative to the built in Grid systems Binance Platform offers.
This utility let you define a grid parameters for interact with your Binance account using an Isolated Margin account. This is, similar to Spot Grid in Binance. This is not for handle with derivatives contracts, is for handle with Spot through Isolated Margin Account. But obviosly this utility offers a different approach than built in Binance Grid to handle the Grid, which I have found useful based o
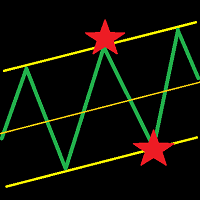
This indicator draws a trend line and a trend tunnel on the chart. You can choose several calculation methods, alerts, notifications, and other settings. It can also draw trendlines from another TimeFrame. You can also use this indicator for your ExpertAdvisor. The current values of the lines are stored in the memory buffer from where the EA can load them. You can trade the price bounce from the upper and lower lines . Settings TimeFrame – trend timeframe Description – show description of line

Otter Scalper is a 100% automated trading robot. It uses a very effective breakout strategy. The money management is automatic. A position is taken when a high or low is reached. The position is secured as soon as possible and followed with a trailing stop loss.
As the average profit is small, it is advisable to trade with a small spread. The performance of the robot can therefore change depending on your broker. It is also strongly recommended not to use this robot if your broker uses commiss
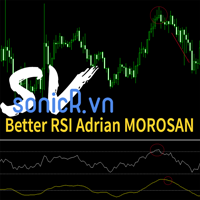
Adrian MOROSAN (2011) examined the same set of data using both traditional and modified RSI. He also incorporated trading volume in the method's calculating formula. Finally, findings acquired using the indicator's traditional form will be compared to those obtained using the modified version. He found that, in comparison to the original form, his version resulted in a greater advantage when a different, even opposing interpretation was used. And, in the alternative case, it resulted in much lar

The Expert Advisor works according to the indicator signals. The adviser works according to the following principle, if the price went the wrong way when opening a deal, then the adviser will open an additional number of orders, to open orders, the adviser counts the number of bars through which to open an additional deal, the number of bars is set by the user in the adviser settings, the bars are counted on the chart period set by the user in the adviser settings. The volume of the subsequent
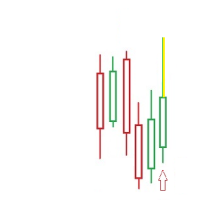
FIRST: I am NOT a coder ! I am a TRADER that was forced to code, because i needed some special tools! So i am sorry for minor graphic-bugs and so on... #############################################################################
- simple Price Action Indicator - NON Lagging ! the Alert shows instantly whats happening - there is a VOLUME-Filter (Candle-Size in points) to avoid alerts with tiny Candles during a NON-VOLUME-Time plus you have a RANGE-Filter-Option (to make sure you get only the
The MetaTrader Market is the best place to sell trading robots and technical indicators.
You only need to develop an application for the MetaTrader platform with an attractive design and a good description. We will explain you how to publish your product on the Market to offer it to millions of MetaTrader users.
You are missing trading opportunities:
- Free trading apps
- Over 8,000 signals for copying
- Economic news for exploring financial markets
Registration
Log in
If you do not have an account, please register
Allow the use of cookies to log in to the MQL5.com website.
Please enable the necessary setting in your browser, otherwise you will not be able to log in.