Watch the Market tutorial videos on YouTube
How to buy а trading robot or an indicator
Run your EA on
virtual hosting
virtual hosting
Test аn indicator/trading robot before buying
Want to earn in the Market?
How to present a product for a sell-through
Paid Expert Advisors and Indicators for MetaTrader 5 - 55

Optimized from 2004 to 2022. Optimize further after this date, use monthly or yearly. Experts need optimizing as markets develop new ranges. New Age Bot trades XAU/USD on 5 minute charts. Entry - Bollinger bands and trend trading reversals is used for entries. Stops - Trailing stops are used with ATR. Money - lots Bollinger band period - 20 MA period - 100 Deviation - 2.0 Symbol for build - XAU/USD Time frame for build - 5 minute charts Risk Disclaimer Trading foreign exchange on margin carri

reguired set file Live Siqnal - is a trading system based on the correlation of several classical indicators with certain parameters to achieve the necessary goals of market entry and exit control. The minimum number of parameters greatly simplifies the work with the Expert Advisor. The strategy is based on a classic overbought/oversold system with the possible influence of market strength on the price movement in a certain direction. Recommendations for trading: - TF H1GBPUSD - leverage 1:500
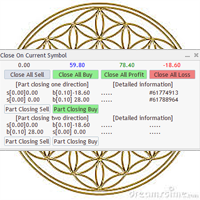
Utility / EA to simplify the exit from the drawdown. Allows you to gradually exit the drawdown correctly, reducing the volume of losing trades. At the same time, profitable trades opened on the same symbol cover losing trades in whole or in part. The volume of partial closing of a losing trade is calculated automatically. Trades opened both in one direction and in the opposite direction are supported. Position Management Closing positions only for purchase, only for sale, only profitable, only

Volatility analyzer is a momentum indicator, which capitalizes on the tendency for price to break out strongly after consolidating in a tight trading range. The indicator also uses a momentum oscillator to show the expected direction of the move when the squeeze fires. This histogram oscillates around the zero line, increasing momentum above the zero line indicates an opportunity to purchase long, while momentum falling below the zero line can indicate a shorting opportunity.
LIMITED TIME OFF

The movement exhaustion is a color rule that helps indicate when the movement will revert its direction. The darker the color, the greater the probability to revert. The indicator is based on the price statistic. Works on every timeframe, every instrument. Five color options: 0. Natural movement. (Gray) 1 - 4. Movement exhaustion (Yellow to maroon) The trader can use it as reversal or exhaustion signal. In a trend following trade it can be used as an exhaustion signal, indicating the movement ca

OPTIMIZE BEFORE BACKTEST AND TRADING Day trade the markets. Any market, any time frame but its recommended to trade 5 minutes for some inputs but experiment with time frames and assets to see the best . It is important to optimize the inputs of the EA before back testing and using. Last month option to a year is recommended.
Parameters for intraday trading are: Weight Weight of signal of the module in the interval 0 to 1. GoodHourOfDay Number of the only hour of day (from 0 to 23) when tra

Every time Trader opens a trade, he must know the profit and risk of the trade he made, so that he can determine the risk and profit opportunity he will get. Determining this calculation manually can be quite troublesome, especially if it has a lot of open trade to do. The Trading Panel Katana is a utility tool that really helps traders meet those needs. Opening a Market or pending trade, determining lots, pips, price positions, how much USD, and what percentage of risk can be set automatically.

=== Next price is 299$ === Real account signal - https://www.mql5.com/en/signals/1702554 MT4 Expert Version - https://www.mql5.com/en/market/product/86453 Timeframe: M1 Recommended currency pairs: EURUSD, GBPUSD, USDCHF, EURGBP, USDCAD, AUDCAD, CHFJPY, EURCHF, USDJPY.
Tsap is the latest development from the Varko Group Inc team. A multi-currency trading Expert Advisor whose strategy is based on low volatility at night. The EA does not use high risk grid, mart

The Roll the Field indicator displays signals in a simple and accessible way in two colors (when to buy and when to sell is determined by changing the color). Knowing the entry point of each currency is very important for every forex trader. The intelligent algorithm of the indicator accurately determines the trend, filters out market noise and generates entry signals.
You need to optimize before back test and use Last Month or Last Year Option in Tester. This is part of this EA, which has more advanced aspects to it: https://www.mql5.com/en/market/product/87051 This Expert work towards a positive expectancy. It take positions in a hedging fashion buy and sell on both sides. A hedge account is needed in order for this EA to do as intended. The EA is based on taking both sides, the random nature of the market and the capability of one side being in a positi

Boleta para operações Long & Short na bolsa Brasileira B3 exclusiva para o mercado A VISTA com lotes padrão. A boleta calcula automaticamente as quantidades dos ativos (compra/venda) da operação baseado no capital informado. É possível determinar os horários de início e término das operações quando selecionado opção para Day Trade. A boleta pode iniciar e terminar as operações automaticamente baseado em horários. Podem ser definidos altos de Ganho (TP) e perdas (SL) em percentual (%). Basta cli
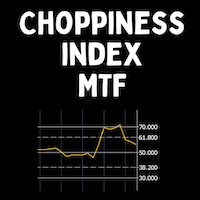
The Choppiness Index was created by Australian commodity trader E.W. Dreiss. It is designed to determine if the market is choppy (trading sideways) or not choppy (trading within a trend in either direction). A basic understanding of the indicator would be; higher values equal more choppiness, while lower values indicate directional trending. The values operate between 0 and 100. The closer the value is to 100, the higher the choppiness (sideways movement) levels. The closer the value is to 0,

MT5 INDICATOR.
This indicator detects and zones of demand and supply on any chart, any timeframe and any broker. It's perfect for technical analysis. By default, the red lines suggest strong selling zones while green lines indicate strong buying zones. Once a line is drawn(green or red), there's a high chance prices will return to that zone to close the line.
INPUTS: (int) Strength_Filter = 1 : This new feature allows user to filter out detection of minor levels. The hig

Are you tired of the stress and frustration that come with Forex trading? Introducing G FORCE , the ultimate solution for a seamless and profitable trading experience. This expertly crafted EA (Expert Advisor) is designed to take the emotion out of trading, allowing you to trade with confidence and ease. G FORCE isn’t just another trading robot; it’s your professional trading partner, engineered to generate consistent profits while you sit back and relax. Whether you're new to trading or a seas

Everything is simple. The usual Information indicator.
Shows on the chart: Current spread, buy swap, sell swap, time to close the candle, broker time.
The indicator can be placed at the top right or at the bottom right of the chart.
Most often, the spread is called the difference between the sale and purchase price.
Swap is the cost of transferring a position to the next day.

Deals printscreen is a script designed to automate the saving of images with account transactions for further analysis. The panel allows you to significantly reduce the time for technical work related to the search for transactions in the history and saving files in the image format with the display and drawing of all operation parameters.
What tasks does this script solve?:
You do not need to search for the desired transaction in the transaction history: you simply select a period and

WavePulse EA uses Price Action strategies and a built-in indicator to look for reliable signals with high winrate and low risk. The EA provides a very balanced risk-reward ratio and survives all market circumstances easily - even the most critical ones like Covid-19, Brexit, etc. It uses a martingale strategy to close all trades in profit. For more accurate trades, it is recommended to use the EA on M15 or higher timeframe. Recommend: Time frame: M15, H1. Use VPS with low latency (< 20ms). Use

One of the main definitions for monitoring the currency market is a trend, which is why the Megan indicator was created in order to display the trend in a visual form. Forex indicator Megan is a real trading strategy with which you can achieve the desired results. As soon as the indicator is set, the main indicators will immediately begin to be recalculated at the price of the traded pair, based on the postulates of technical analysis. In addition, when potential entry points are detected, visua

DESCRIÇÃO O indicador EasyFollowerTrader-Bot2-DayTrade opera apenas a favor da tendência. Assim, o indicador, em primeiro momento, observar a tendência de três médias síncrona com o time-frame selecionado. Em seguida, o indicador observar a tendência do gráfico diário. Quando estes dois gráficos estiverem se movimentando na mesma direção, teremos a maior probabilidade de ganhos. Chamaremos esta região como região de alta probabilidade de ganho. Na região de alta probabilidade de ganho, o ind

F22 Raptor is a highly reliable, low risk EA, based on statistical arbitrage idea. Expert don't use any dangerous methods of money management and suitable for any broker conditions. The Expert Advisor tracks two correlated currency pairs at once and determines the moment, when a strong divergence occurs between the pairs. Then it opens opposite trades for each currency pair. Profit is formed during the reverse convergence of currency pairs. The Expert Advisor dynamically fixes profits and limi

Optimize before use in back test or live for better results for you and don't forget to account for spreads and slippage in optimization. This Expert is for 1 minute charts trading BTC/USD. Bitcoin on 1 minute use MACD, CCI and RSI for entry and exit logic. This EA was back tested and traded out of sample. Each trade has a stop loss and take profit. BTC compared to the indexes and Gold have huge differences, look at the example of traditional investing vs. Bitcoin. Yellow line represents
"EA Maximum Breakout Scalper" - the scalper uses 2 breakout strategies. 1 - strategy for the breakdown of the nearest support and resistance levels. The system uses the search for extremes using smart technology to recognize high-quality and low-quality breakdowns, with support for filtering extremes. For the training of the adviser, the history of quotations for 22 years was used. 2 - strategy for the breakdown of the nearest candles. A smart technology is used to recognize high-quality and lo

The Average Daily Range (ADR) is an indicator that shows how far a currency pair can move in a day. Automatically displays the upper and lower ADR levels. Automatically calculates the percentage and distance of ADR achieved by the currency pair for the day. Notifies when the price reaches the ADR level. Changes the color and thickness of the ADR line when the price reaches it.
DESCRIPTION
The EasyFollowerTrader-Bot3-DayTrade indicator only trades with the trend. Thus, the indicator will, at first, observe the trend of three averages synchronous with the selected time-frame. Then the indicator observes the trend of the daily chart. When these two charts are moving in the same direction, we have the highest probability of winnings. We will call this region the region of high probability of gain.
In the region of high probability of gain, the indicator will indicate

DESCRIPTION
The EasyFollowerTrader Bot4 DayTrade indicator always trades with the trend. Thus, the indicator, at first, observes the trend of the average of the highs and lows of the candles of the selected time-frame. Then see if this trend is in line with the trend of the daily chart to operate in favor of the major trend. When these two charts are moving in the same direction, we have the highest probability of winnings. We will call this region the region of high probability of gain.
In

EA " Swing trade by porl " can use for EURUSD XAUUSD GBPUSD time frame H1 for good. The default settings can be used for saving ports EURUSD. but the minimum profit If you want high profit You can set the inputs you want. only that the value that is put into the supplied, if managing money in the port To fit, there will be a relatively stable profit. If adjusting the higher lot, the risk will be higher as well, but the profit will come according to the risk we invest. We recommend that every

MA Slope is a simple indicator that measures the slope of a specific Moving Average. We usually say that the price is in an uptrend when it is above the moving average, or it is in a downtrend when it is below the moving average. However, this information is inadequate since most of the time the market is in range. During range-bound markets, price moves back and forth around the Moving Average giving a lot of false signals. MA Slope helps identify and validate trends as it directly measures t

Real account signal - https://www.mql5.com/ru/signals/1679047 MT4 Expert Version - https://www.mql5.com/ru/market/product/86048 Timeframe: M1 Recommended currency pairs: EURUSD, GBPUSD, USDCHF, EURGBP, USDCAD, AUDCAD, CHFJPY, EURCHF, USDJPY.
Cicada - the latest development from the team Varko Group Inc. A multi-currency trading Expert Advisor whose strategy is based on low volatility at night. The EA does not use high risk grid, martingale or averaging strate

Este EA posue a opção de compra ou venda, você escolhe. Ele permanece sempre em operação, saindo de um com saldo positivo entra imediatamente na operação proxima. Não possui nenhuma estratégia de entrada com análise de mercado, apenas comprar ou vender a escolha do cliente. Ele tem um trunfo para operar martingale, Não se assuste com os resultados!! Se tiver um bom fundo de investimento usar pode usar essa ferramenta para ampliar o patrimônio. Teste muito este EA e compre sem MEDO.

A version based on David Waves' description in his book 'Trade About to Happen' of his adaptation of the Wyckoff wave chart. The indicator directionally accumulates volume, adding to each brick or candle close, with color indication for up and down. it can be used it with tick or real volume, it also changes color when the accumulated value of the previous wave is exceeded, being the trade signal. Yellow color is used for doji candlestick, it will continue with accumulation without zero the sum
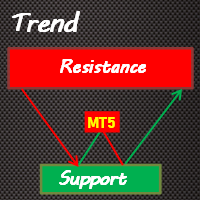
Trend Support Resistance is a fairly simple indicator that provides traders with confirmed immediate support and resistance in whatever timeframe you monitor. It's good for short-term and long-term order blocks. With the default settings, the indicator identifies critical support and resistance areas. Bearish Order Blocks are around the OrangeRed areas while Bullish Order Blocks almost always form near the LawnGreen areas. We have also added a Multi-timeframe feature that can be helpful to allow

Market Steps indicator is designed and built based on Gann Time/Price correlations and optimized by Price Action specific rules for Financial Markets such as Forex. It uses Market order flow concepts to predict potential price zones for high volume of orders. Indicator Levels can be used for trading itself or as a combination for filtering wrong signals of other Strategies/Indicators. Every trader needs such powerful tool to have multi-time-frame (TF) zones and price movement potentials togethe

Optimize EA before test and buying. Euro King is for trading EUR/USD on 15 min time frames. Optimize to find the best stop loss and take profit for your risk management. This EA does not trade hundreds of times a day. In the test it traded 100 times in a year. Try other time frames to see if there optimizations for different results. The EA uses Bollinger bands, moving averages and RSI for logic in the entry and exits. Martingales are not used and all trades have a stop loss and a take pr

66% discount only for the first 5 buyers (4 left), main price: 300 $ Show the signal as a line graph Prediction of 10 future candles and advanced display Prediction of individual candles graphically Can be used in the gold symbol Can be used in 15 minutes time frame Can be used only in gold symbol and only 15 minutes time frame
How the indicator works:
Using complex mathematical calculations, it predicts the future 10 candles. The predictions of this indicator are based on price. Theref

Proportional Trade Correction Prop Firm trading MT5
If you found this EA, it's probably because you're in a really specific situation. Here are the conditions if you want to use this EA correctly : - You want to be a prop firm trader. - You want to use signals from MLQ5 market. - You want your trades to be proportional to the signal provider.
If you're smart and you want to leverage your money thanks to prop firm trading without knowing how to trade, here's what you may think : "I will get

The indicator will plot a line on the chart that corresponds to the closing price of the previous day, and based on this, it will plot the percentage levels of change in the price of the asset in question. It can be used on any asset. Period: Determine whether the closing price should be daily, weekly or monthly Minimum percentage: Determine the percentage for the indicator to plot the levels and sub-levels on the chart, eg 0.5 it will plot on the chart a line for every 0.5% variation and the su

Write this EA for my own use. but decided to sell it as well . The EA has a wide variety of uses. Can be set as you wish. But please understand that profits depend on the capabilities of EA users. Not just the EA alone. I try to reduce the difficulty of use. Make EA easier to use and more friendly to investors. I want everyone to try the demo before actually buying it. To make sure this EA is right for you or not. ... About setting up my EA click that youtube link.

Theory VWAP is a volume-weighted moving average, bringing greater relevance to prices. The VWAP base calculation follows the classic formula described in Investopedia ( https://www.investopedia.com/terms/v/vwap.asp ). VWAP = sum(typical price[i]*volume[i]) / sum(volume[i])
Functionalities
Orion Intraday VWAP innovates by allowing the user to choose between the conventional Daily, Weekly and Monthly periods, also having the option of calculating the Intraday indicator, as used in other platfo

Fundamentação teórica A VWAP é uma média móvel ajustada pelo volume, ou seja, o peso de cada preço corresponde ao volume de ações negociadas no período, dando mais importância ao período em que se tenha mais negociações. A Orion Vwap Bands permite que o usuário use plote 8 bandas que podem ser utilizadas como suportes e resistências para o preço. Cada banda é calculada a partir da Vwap Tradicional:
Ex.: Se escolhermos o valor 0.25 para a plotagem da Banda 1, pega-se o preço da Vwap e acrescen

- 50% off - Telegram group : https://t.me/+5RIceImV_OJmNDA0 MT4 version : https://www.mql5.com/en/market/product/84526?source=Unknown%3Ahttps%3A%2F%2Fwww.mql5.com%2Fen%2Fmarket%2Fmy
Master Pullback is a complete system that gives unique trading opportunities and a clear indication of the market: trend, signals as well as stop loss and take profit levels. This system has been designed to be as simple as possible and detects extreme overbought and oversold zones, support and resistance levels, a

TRAILINATOR is a unique Solution to use different Trailing-Stop Variants and change your Tradesetup via Remotecontrol. You configure your Tradesetup for a specified Symbol only once. This setting will be used for all your Positions of the same Symbol. Currently we support these Features: different Trailing-Stops: Standard: works like you use in Metatrader Terminal, starts trailing if your profit is greater than trailing stop Start after points: trailing stop will start after your defined poin
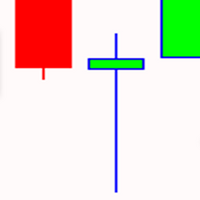
OPTMIZE EA BEFORE BACKTEST AND USE. Gold Pin Bar trade XAU/USD on 1HR charts using moving averages and pin bars. Pin bars are used to pick higher probable trades that can occur. The price is pushed up or down forming the pin bar signaling who has control over the price. Optimize for the best settings for stop loss and take profits and don't forget to account for spreads and slippage in optimization. . All order have money management and the EA doesn't use dangerous trading strategies. Rest as

Hello;
This product generates buy and sell signals from the intersection of two moving averages. It uses all the capabilities of the moving averages. To generate a scalping strategy, a take profit level is determined after the signal level. To stop the loss, it uses the reverse signal. The system can increase the lot amount according to the fibonacci ratios after each loss .To disable this margintale feature, you will need to enter the low lot and high lot amounts the same. So you can work wi

OPTMIZE EA BEFORE BACKTEST AND USE. United States Stock Market Index US500 trades the 5 minute charts. The EA uses RSI and Stochastics for entries and ATR for exits. The building period was From 2021-03-19 to 2022-08-18. Continually optimize the EA to find best settings and don't forget to account for spreads and slippage in optimization . The EA does not use martingale and has a sl and tp on each trade with a fixed lot input. Try it out in the back test, optimize for settings.
Risk Di

Do not buy before seeing the Danko Trend Color product, as this panel is a way to view a summary of this indicator on various timeframes.
The Danko DTC Panel utility allows you to look at the trend in up to 5 timeframes. When clicking on the timeframe texts, a new window will open with the indicator plotted on the screen so you can see the complete chart. The width of the panel, with the amount of candles you want to see, is customizable, see the images below.
Ao clicar nos textos dos timefra

It is an indicator used to identify support and resistance points from the daily VWAP and you can use it to check the best entry and exit points.
The calculated value of the channel distance can be calculated in several ways:
- Manual Defining the value to be projected to calculate the distance of the channels.
- Automatic Select the timeframe to be used. Regardless of the graphic time that is on the screen, if the parameter is changed to H1(One hour candles), the system will c

Boom and Crash Buy and Sell Trend. Non-repaint. Can be used on all timeframes 1 minute for scalpers. 5 minute to monthly timeframe for swing trading. works on all boom and crash pairs Crash300, Crash500, Crash1000. Boom300, Boom500, Boom1000. Green histogram colour means the trend is up(bullish) Buy signal. Dark orange histogram colour means the trend is down(bearish) Sell signal.
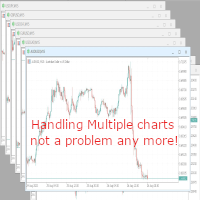
With this script you can open or close multiple charts with just one click. Please follow the instructions below; Set your desired symbols in the market watch window. Open one chart. Attach the script to the chart In the input values just select the time frame of your chart. Set open chart value to true. Click ok. To close the charts follow step 3 and 7. In input values set open chart value to false and close chart value to true

Turn Stock Manager into Your New Business Opportunity – You can sell Stock Manager to your customers as a service by selling License. – The Licenses is managed in a Web Admin dashboard. – Highly flexibility structure that allows customers to host their database in Cloud or Self-hosted. – Admin/Staffs can create unlimited number of license for selling. please test me now

V Band is a technical analysis tool that helps smooth out price action by filtering out the “noise” from random price fluctuations. It is calculated by taking the average of a market’s price over a set period of time.
It can be applied to stocks equity indices, commodities and Forex . V Bands is used to identify trends or support and resistance levels.
They can also be used to generate buy and sell signals.
Choose a trading style and start trading!

https://www.youtube.com/watch?v=0T8Mge39Xsk&t=9s
Youtube Sell only EA here.
These EAs trade macd divergence only if there is a parabolic sar change at the same time.
Buy bullish macd divergence & parabolic sar crosses below price Macd settings Threshhold is how far above / below zero divergence must occur. Timeframe used Parabolic sar settings
Only one trade in that direction can be opened at once. Trades on open bar Alerts , mt5 and mobile Stop loss and target points Stop loss is set

Utility for automatic order and risk management. Allows you to take the maximum from profits and limit your losses. Created by a practicing trader for traders. The utility is easy to use, works with any market orders opened manually by a trader or with the help of advisors. Can filter trades by magic number. The utility can work with any number of orders at the same time.
Has the following functions:
1. Setting stop loss and take profit levels;
2. Closing trades by trailing stop level

Waterstrider Cash Register
A High Risk trade with Martingale grid
The trend is based on the h1 chart, and scalping in m1-m15 chart.
Pair EURJPY, USDJPY, AUDUSD
8 position will open if against the position, and when the 8 position reach, a hedge position will open to increase the equity balance with small tp and re entry every 10% DD. after that the ea will calculate the open position and the hedge position and will close all in profits. No guarante for profit, you can try this with you
This EA utility does not trade on its own, but it only modifies the open trades to add take profit and stop loss that was opened manually or by any other expert advisors.
The distance is based on Average True Range Indicator(ATR).
How Does It Work?
If Symbol to modify is set to "All Symbol" simply attach it to one chart, and all open trades in the entire terminal will set the take profit and stop loss with the distance of Average True Range value of their corresponding symbol.
If

The indicator calculates intraday levels based on the average daily price range, builds support and resistance levels that may be reversal.
Parameters Period ATR - period of the ATR indicator Shift time - time offset for the opening of the day Color opening of day - color of the opening line of the day Color 1AR, -1AS - line color 1AR, -1AS Color AR 1/2, AS -1/2 - line color AR 1/2, AS Color AR 1/4, AS -1/4 - line color AR 1/4, AS -1/4 Color AR 3/4, AS -3/4 - line color AR 3/4, AS -3/4 Colo
Telegram Utility EA link to any private/public bot and can help you to: Close all Orders Instantly by command. The command is encoded with your custom password and only you know. Telegram bot will tell you when all orders are closed and even Pause all other running EAs in your MT5 Terminal. Pause/Resume any other EAs running in the Terminal with just one click! Export trade report by pips form or money form. Send buy/sell signal to bot or your community ( telegram chat group, telegram channel).

The indicator calculates the correlation coefficient of 2 instruments, shifts the chart of the 2nd instrument relative to the 1st and displays the charts of both instruments on the current chart. The maximum positive and negative deltas and the current delta as a percentage of the maximum are calculated. It is possible for signals to set a delta for entry and exit with displaying the direction of entry into trade for each instrument. The space between the charts is also filled with different col
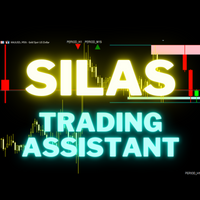
Silas is a trading assistant for multi-timeframes traders. It show on the screen, in a very clear way, all the informations needed to suits to your trading. It show : - Supply and demand zone from 2 timeframes of your choice - Setups based of market structure from 2 timeframes of your choice - Daily current high and low points - The last 2 closed candles and the current candle from an higher time frame on the right of the graph. - Actual daily candle on the left Everything is customisable !

Angle of Moving Averages This indicator is very simple yet powerful concept which constantly calculate the slope of the current bar moving average with respect to the N bar before moving average value. This no only give a good entry and exit signal but also it shows traders the strength of the signal. It shows positive green histogram when market is moving toward upward direction and red histograms for downtrend. When large histograms found means market has very strong trend. Inputs Available

DESCRIPTION The EasyFollowerTrader Bot1 DayTrade indicator operates only in favor of the majority trend. Thus, the indicator, at first, observe the trend of the daily chart to operate in its favor. Then the indicator watch the current chart trend. When these two charts are moving in the same direction, we have the highest probability of winnings. We will call this region the region of high probability of gain. In the region of high probability of gain, the indicator will indicate the best ent

Welcome to Investment Castle products This product is exclusively available in the MQL5 market and is not available and will not be available anywehere else. The Combined indicator is a multi-time frame indicator and it is built using 3 indicators: Bands indicator which draws the support and resistance key levels using up to 5 different time frames Patterns indicator which draws the chart patterns using up to 6 different time frames Spots indicator which shows the common candlestick patterns Yo

An arrow technical indicator without redrawing Signal Breakthrough in the Forex market is able to give tips with the least errors.
Every rise and fall is reflected in your emotional state: hope is replaced by fear, and when it passes, hope appears again. The market uses your fear to prevent you from taking advantage of a strong position. At such moments you are most vulnerable. Currency pairs never rise or fall in a straight line. Their ups and downs are interspersed with rollbacks and revers

The Active Trend indicator helps to analyze the market on the selected time interval. It defines the mainstream. Used in trading. You can use so basic to determine the trend. The indicator works well on both short and longer trend sections. In flat it is recommended to use filters of your choice. It can accompany the position with a stop, it is recommended to set the stop at a fixed distance from the point formed by the indicator. The simplest way to use the indicator is to open a trade in the

Inventory Retracement Trade it is designed based on one of the most popular tradingview indicator. This is mostly combined with other popurlar trend indicator to confirm the strength of the movement. Definition Inventory Retracement Trade is quickly becoming one of the most popular ways to identify where short-term counter trend institutional inventory has subsided and when it’s time to re-enter into a trade’s original trend direction.

ESS ENGUIFING STATEGY SIGNALS
This indicator detects envelope type candles to which a filter is applied, this filter is made up of 3 strategies together, with which it is possible to identify the greatest possible effectiveness within the measurable parameters.
The signals are indicated by upward and downward arrows for each of the directions, and you can also activate or deactivate alerts, emails and push messages to the mobile.
It is worth mentioning that no indicator is 100% effective,

Top indicator for MT5 providing accurate signals to enter Trades.
This Indicator will provide pretty accurate trading signals and tell you when it's best to open a trade by giving alerts to buy or sell. Mainly was created to target Volatility Index on Deriv broker however, the Spot Detector Arrow Indicator can be applied to any financial assets(Forex, Crypto, Indices, Volatilities) on MT5 Brokers.
HOW TO BUY Wait for signal Alert to Buy will be sent to your MT5 Terminal Blue arrow facin
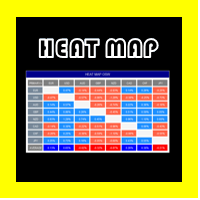
HEAD MAP OSW
This indicator is ideal to know the current state of all currency combinations and to know their variation.
The variation is calculated by the percentage movement of the price from the current price to 24 hours ago, or whatever is configured in the menu.
To know the variation of a currency, you simply have to look at the primary currency, example:
in the EUR you have to look vertically to compare with other currencies and at the end of it all, you find the average of all th

В основу алгоритма этого трендового индикатора положен анализ веера сигнальных линий универсального мувинга I . Алгоритм вычисления сигнальных линий выглядит следующим образом. В качестве исходных данных имеем входные параметры индикатора: StartLength - минимальное стартовое значение первой сигнальной линии; Step - шаг изменения периода; StepsTotal - количество изменений периода. Любое значение периода из множества сигнальных линий вычисляется по формуле арифметической прогрессии: SignalPeriod(

PRESENTATION
This EA uses several non-directional strategies that allows it to generate profits regardless of price trends. It manages a pool of positions ("session") in a totally autonomous way To avoid risks related to this strategy, several recovery functions have been implemented. This makes it a reliable and secure EA, its DD remains low.
RECOVERY MODE This EA is designed to run on several pairs simultaneously on an account. When the DD of a session exceeds a defined value, all positions

Wink IND is an indicator that tell you: -when MACD is saying buy or sell -when RSI is saying buy or sell -work on multi timeframes MT4 Version
by Wink IND: you don't need to have Knowledge about MACD or RSI don't need to check and compare MACD and RSI respectly don't need to check all of timeframes and compare the resaults don't lose time, save more time for your decisions in trading
Wink IND: multi timeframe indicator multi currency indicator show the positions by graphic shapes, arrows an
The MetaTrader Market offers a convenient and secure venue to buy applications for the MetaTrader platform. Download free demo versions of Expert Advisors and indicators right from your terminal for testing in the Strategy Tester.
Test applications in different modes to monitor the performance and make a payment for the product you want using the MQL5.community Payment System.
You are missing trading opportunities:
- Free trading apps
- Over 8,000 signals for copying
- Economic news for exploring financial markets
Registration
Log in
If you do not have an account, please register
Allow the use of cookies to log in to the MQL5.com website.
Please enable the necessary setting in your browser, otherwise you will not be able to log in.