Watch the Market tutorial videos on YouTube
How to buy а trading robot or an indicator
Run your EA on
virtual hosting
virtual hosting
Test аn indicator/trading robot before buying
Want to earn in the Market?
How to present a product for a sell-through
Expert Advisors and Indicators for MetaTrader 5 - 176

Note: If you want to apply this indicators on indicators which are shown in a sub-window, then consider using this indicator instead: https://www.mql5.com/en/market/product/109066.  ; AIntel Predict - Your Gateway to Future Trading Success! Unlock the power of predictive analytics with AIntel Predict. Say goodbye to the guesswork and hello to improved forecasting, as AIntel Predict leverages historical data to unveil the future of your trades like never before. Whether you're a seasoned tra
How does the EA work?
This is a simple EA that trades Bullish & Bearish Engulfings. At the end of a candle, the system checks whether the previous candle, including the wick, has been reversed.
If this is the case, a stop order is placed in the market for 1 candle in the direction of the trend.
What was the focus on?
The focus is on particularly small account drawdowns.
Other information?
I have achieved the best results on M30 in DAX.c. In principle, however, you can also trade all other

EA that operates with price action, through one of the most traditional setups on the market, using a pure price analysis.
Optimized EA with very low processing load, ideal for small VPS, with easy plug and play.
Strategy Analyzes the purchase and sale entry through the maximum and minimum of the current candles of the current timeframe. Risk management, with the possibility of daily gain and loss limits Multi currency, without any restrictions
Settings available Start time to open operations

Hello community, on this occasion I present to you Volatility50 Mountain that has the stochastic el cruze strategy It is already configured with its parameters for purchase (BUY) It is used in a time frame of 1 MINUTE He is a scalper but passive. You have to configure the recommended lot is 0.50/1 with balance of 300USD the stoploss at 450000 take profit at 6000 Then it is used as is, as it comes with those parameters. For this week it will be worth 70.00USD, then it will go up. without more goo
Expert Series: SimSim Multiple ADXWilder MT5 Advisor.
Multi-currency and multi-period, uses the ADXWilder indicator (Average Directional Movement Index by Welles Wilder).
The advisor works with data obtained as a result of optimization.
Three steps to generate source files for the advisor to work.
Step #1. We create a ????.Xml file.
T_Tf = H1 - Selection of time frame. Time frame.
K_Period = 21 - Averaging period.
P_Prof = 0 - Take Profit. Profit level.
S_Stop = 0 - Stop

Black Friday PROMO launch for 4 remaining copies from 10, next price 199 USD
The Expert Advisor has been developed by AI for Dow Jones M5. There is no need to set up parameters, all settings are already optimized and fine-tuned. Recommended broker RoboForex because of EET timezone.
My recommendation is to have a look also at the rest of my products in the portfolio, as they work very well together in combination. Check other portoflio screenshots.
Dax Ai , Daw Ai , Niki Ai , Daq Ai , Sap Ai

A very usefull EA helps you control Trailing Stop and Break even point for single order
it works seperately for Buy side and Sell side
the EA displays some information useful when you load to your chart
all you need to do is to change the name of the pair you want to control TP and BEP
it works with all pairs and all types of accounts
if you have any questions you can always write to us at info@auranos.me

Black Friday PROMO launch for 4 remaining copies from 10, next price 199 USD
The Expert Advisor has been developed by AI for Nasdaq and H4 timeframe. There is no need to set up parameters, all settings are already optimized and fine-tuned. Recommended broker RoboForex because of EET timezone.
My recommendation is to have a look also at the rest of my products in the portfolio, as they work very well together in combination. Check other portoflio screenshots.
Dax Ai , Daw Ai , Niki Ai , Daq A

Black Friday PROMO launch for 4 remaining copies from 10, next price 199 USD
The Expert Advisor has been developed by AI for SP500 and M15 timeframe. There is no need to set up parameters, all settings are already optimized and fine-tuned. Recommended broker RoboForex because of EET timezone.
My recommendation is to have a look also at the rest of my products in the portfolio, as they work very well together in combination. Check other portfolio screenshots.
Dax Ai , Daw Ai , Niki Ai , Daq A

Multi-currency trading on one chart!
Creation and management of positions with trailing and breakeven, risk management and other useful functions. To fix profits, the Target profit parameter is provided; if it is greater than zero, all positions will be closed if the set value is exceeded. All positions and orders have set Stop Loss and Take profit. For multi-currency trading, taking into account the impact of news and switching symbols on the chart, it is useful to use the News impact indicato

DeMarshall Pip Hunter EA is a powerful and advanced trading expert advisor designed and built with confidence to help traders in the financial market. This expert advisor utilizes sophisticated algorithms and technical analysis to identify profitable trading opportunities and execute trades with precision. It is equipped with features such as trend detection, risk management, and customizable settings to cater to different trading styles and preferences. DeMarshall Pip Hunter EA is suitable for

Meet Thor EA: Your Ultimate Forex Trading Partner Thor EA is a state-of-the-art Expert Advisor (EA) designed for MetaTrader 5 (MT5), blending cutting-edge automation with intelligent decision-making to elevate your forex trading. Engineered for precision and adaptability, Thor EA simplifies trading while offering advanced functionality for traders of all experience levels. Pre-optimized for XAUUSD on the H1 timeframe, with unique magic number generation for seamless trade tracking and a robust

This is a very simple EA which uses distance from EMA Crossover strategy to open automatic trades. It has NO stop loss but has the take profit in money feature. This is an optional martingale system,it has a lot multiplier option if you want to use it to increase the successive trade volume. Don't trust the description, just download the demo today and test it yourself to know more about this trading robot. (Backtest on longer periods like 5-10-20 years with 99-100% tick quality). Recommended:

Introducing the "Crypto Ripper" application for MT5 This application is compact and ideal for entering the crypto market. It is designed in a minimalist style with fully preconfigured settings for immediate use. The robot can operate on a single symbol or as part of a portfolio. By default, it opens market orders but also supports stop and limit orders, eliminating the need for additional preset files. The recommended timeframe is H4, and suggested cryptocurrency pairs include Bitcoin, Dogecoin,

Crypto Digger Expert Advisor The Crypto Digger Expert Advisor (EA) is an advanced trading tool designed with flexibility and precision in mind. It offers the ability to execute various types of orders, whether buy, sell, or both, making it adaptable to different market conditions. Users can choose between a sophisticated money management system, which adjusts the lot size dynamically, or set a fixed lot size for a more controlled approach. This ensures that the EA adapts to market volatility, pr

The recommendation is to use the robot in the H1/H4 timeframe with LIMIT order types. The robot is crafted in a minimalist style, yet it possesses all the features of a fully rounded system. Therefore, the robot has options that allow it to work with all types of orders, reverse positions, and an advanced money management system. All exit rules are calculated based on independent ATR (average true range) indicators. Each instance must have a unique ID or magic number if the robot is used on vari

Automate your MACD strategy! This EA alerts and/or places orders according to MACD strategies with additional filters. It means that you can use it by 2 different ways: Receive alerts based on your MACD strategy with filters on multiple symbols simultaneously in a single chart window; Choose the fully automated mode and let EA place orders based on your MACD strategy, filter choice and money management. This EA works with all broker symbols and contains multi-symbol modes (market monitoring, ma
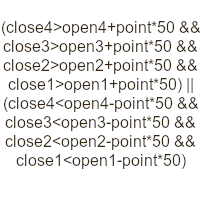
Indicator for research and finding candle bars patterns real time. Options: Alerts - Enabling alerts Push - Enable push notifications BarInd - On which bar to look for patterns for notifications (1 - formed, 0 - forming) ID - Identifier. Appended to the names of graphic objects and to the message Formula - Formula. In the bar price formula: open1, high1, low1, close1, etc. (open0, high25... any number, 0 is also possible - low0, open0...). Counting bars from right to left from zero. You can use

Thank you for checking out Historic Resistance Scalper MT5. EA logic: At the end of the trading day this EA will draw 2 lines on your chart. The Lines will be drawn at the HIGH and the LOW of the previous day. When price reaches these levels the EA will quickly scalp the bounce that is highly likely to occur. IF price breaks through the level, then it will wait for the next High or Low to be reached and perform a recovery trade that will close the basket out at breakeven or with a small profit.
Forex trading advisor Arog is an automatic scalping system that opens and closes transactions using a special tick analysis algorithm programmed in code without human intervention. The main task is to instantly make a deal where a person wastes time on analysis and decision-making. Scalp trading or scalping is a short-term trading strategy that a trader uses to frequently make small profits from small price changes that add up to a large amount over time. This strategy is very popular in

EquitySafe V1.0 is a powerful risk management tool designed for MetaTrader 5 . It enables traders to effectively manage their risk by setting maximum loss limits based on custom time frames. With this tool, you have the flexibility to define your own time intervals and allocate specific risk thresholds accordingly. This helps you maintain control over your trading account and minimize potential losses. By utilizing EquitySafe, you can ensure that your trading strategy aligns with your risk tole

Join Nexus Community Public Chat Tracking Account This EA is part of Nexus Portfolio - a combination of the b est long term EAs I created for my personal trading as well as private fund management.
About PulseTrend Algo: As a proven market knowledge, currencies exhibit strong trends during their respective sessions. For example, GBP pairs often breakout and find direction during the start of London session, while JPY pairs follows the trend of the day during Asian session. PulseTrend Algo

The Higher Power indicator is based on the Smart Money Concept (SMC) theory and is the foundation of order flow analysis. Used for analysis of entry and exit areas. Indicator reference: Trading HUB 3.0 Although ICT (The Inner Circle Trader) did not give himself a name for the strategy he developed, his audience gave this strategy many names, and most of them were derived from the words he taught. For example, ICT often says smart money, so SMC (Smart Money Concept) came into being; When analyzi

Introducing Ultimate Ranger, a revolutionary trading robot meticulously engineered to offer traders a sophisticated, non-Martingale-based strategy designed for consistent profitability within the exclusive trading parameters of Range Break 100 and Range Break 200, available solely on the Deriv trading platform.
Distinguished by its steadfast avoidance of risky Martingale principles, Ultimate Ranger is crafted to secure reliable profits. This cutting-edge robot capitalizes on market movemen
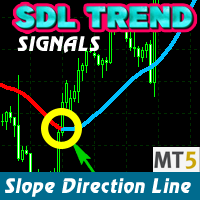
The SDL Trend Signals MT5 indicator shows the market direction with a colored moving average line. It has three inputs: Period (calculation period), Method (calculation method), and Applied price (price used for calculations).
The indicator has three buffers: Uptrend, Downtrend, and ExtMapBuffer (for indicator values). The Bullish slope is in BLUE, and the Bearish slope is in RED. For example, an upward slope indicates a Bullish market (Blue), and a downward slope indicates a Bearish market (R

Its focus is on advanced strategies that identify trading signals based on key indicators. Featured Features: MACD Signal Analysis : The EA uses the Moving Average Convergence/Divergence (MACD) indicator to identify trading opportunities. Logic is included for MACD reversal, crossover and crossover signals. Position Management : Offers advanced position management features, including closing all open positions and checking the existence of positions for a specific symbol and magic
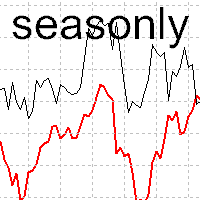
The tool for exploring seasonal patterns. It compares the chart with charts of other years and compares with the average for other years. Allows you to shift charts if necessary. Explore any year by specifying the zero point. Up to 10 charts in one tool. Works only on the daily chart ! The best for you! Enjoy your work! (It's not indicator - do not download demo it not work) for mt4 Seasonly MT4

Note: This indicator is for sub-window use and not for the main chart. If you need to apply it for the indicators in the main chart, then use this indicator instead: https://www.mql5.com/en/market/product/108876 AIntel Predict - Your Gateway to Future Trading Success! Unlock the power of predictive analytics with AIntel Predict. Say goodbye to the guesswork and hello to improved forecasting, as AIntel Predict leverages historical data to unveil the future of your trades like never before. Whe

The indicator displays the High and Low levels of the previous day, week and month. Designed to determine the breakout of extreme points and determine the direction of entry into trading. To more accurately determine reversal levels, you can display Fibonacci levels. It is also possible to paint over the space between High and Low to more clearly display price movements for the previous billing period. There is an indication of the time until the current candle (bar) closes. Version 2.0 added si

No Brain Gold EA
***************************************************************************************************************
It is the most Simplest Expert advisor in the world !! User only need to plug in MT5 platform.
No Learning, No Parameters, No Setup, No Monitoring ! You only need to match the GOLD symbol with your broker, put it onto 5 minutes chart. THAT'S ALL !!!
On the contrary, its intelligence is Not simple - it uses several indicators and slope to detect the buying or sellin
Warning! This is a Martingale Trading System. This EA uses the Bollinger Bands indicator to open automatic trades on your account. If price crosses the upper/lower Bollinger band with certain distance (in pips), it opens an initial trade. After that initial trade, if price moves certain distance (in pips) from the initial trade, EA will open next trade with Martingale Lot and so on. Not recommended to use it on trading accounts smaller than 10K. Even on 10K+ account you have to use it with caut

An automated trading system based on the "AW Turtles" indicator strategy. Signals to enter a position at the moment of breakdown of the support or resistance level. The advisor has the ability to average, the function of closing the first and last orders of the basket, and the function of automatic lot calculation. There are different scenarios for exiting a position using several StopLoss, Traling and TakeProfit options. Instructions -> HERE / MT4 version -> HERE Advantages:
Connectable autom
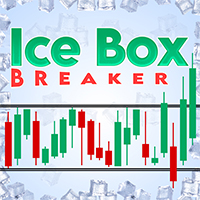
Ice Box Breaker robot identifies the high and low regions and enters trades to the direction of the market whenever one of these exhibits a breakout.
The robot allows the trader to specify multiple parameters such as the start and end time for forming a high -low trading zone, trading hours and exit times for active trades.
Several other options to filter the entries based on volatility , as well as control for how many active and trades can open in a day.
The optimisation parameters allow

The Overnight Gap Trader is an advanced Expert Advisor (EA) specifically designed to help traders trade the markets more efficiently. This EA uses price gaps that arise overnight to make buying and selling decisions.
Main functions : Trading price gaps that form overnight between the previous day's closing price and the starting time's opening price Detecting the gap and placing the order in the direction of the gap closure Closing the trade when the gap is closed, the stop loss or closing pric

Introducing MEGASPIKES CLASSIC_EA Embark on a new era of trading excellence with MEGASPIKES CLASSIC_EA, a revolutionary Expert Advisor meticulously crafted to harness the power of artificial intelligence and neural networks in navigating the intricate landscapes of Boom and Crash markets. This cutting-edge trading bot is not just an advisor; it's your gateway to unparalleled precision, adaptability, and profitability.
Key Advancements: Tailored for Boom , Crash , DEX indices and Rangebreak N
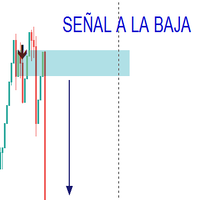
El indicador trabaja con patrones funcionales y divergentes obteniendo del mercado las mejores señales para compra y venta, ha sido testeado por 2 años mediante la estrategias personalizada. El indicador envia la señal para la compra y venta de acuerdo al analisis desarrollado en el mercado. Solo ha sido comprobado en el mercado de indice sintetico (CRASH, BOOM VOLATILITY, STEP)
A news trading expert using deferred multi-directional stop orders. Prior to the release of significant news, the advisor places pending BuyStop and SellStop orders, closing the opposite one in case either is triggered by the market. The expert is integrated with an mql5 calendar for a year, allowing you to customize the advisor's parameters for any event from the calendar and test it on historical data. Features: Before starting the testing, attach the expert to the trading chart (The expert wi

In the dynamic world of financial markets, staying ahead of the curve is paramount. Traders and investors require sophisticated tools to analyze market trends, make informed decisions, and optimize their strategies. Introducing the Moving Average of Accumulation/Distribution (MAAD) Indicator – a powerful tool designed to provide insightful signals for navigating the complexities of the financial landscape. Key Features: Precision in Trend Analysis: The MAAD Indicator employs a moving average met
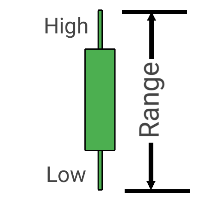
Introducing High Low Rang e, your key to disciplined trading in the dynamic world of Forex. This MQL5 Expert Advisor is meticulously crafted for trend enthusiasts, offering a strategic edge with its unique trailing stop mechanism that dynamically adjusts to market volatility.
Strategy: Harness the power of trend following without the clutter of indicators. High Low Range relies on pure price action, excelling in identifying and capitalizing on market trends.
Risk Management: Rest easy as the

This expert advisor implements the conventional quantitative trading algorithm known as Pairs Trading. It operates by identifying a hedge ratio between two correlated trading symbols, thereby generating a synthetic stationary symbol suitable for trading through a mean-reversion strategy. The expert advisor dynamically computes the optimal hedge ratio for the selected symbols and initiates synthetic BUY/SELL positions when the spread of the synthetic price deviates from the mean level, reaching e

Signal : https://www.mql5.com/en/signals/2236743 After buying EA contact me to get an invitation to a private group Price Action FX is a professional strategy based on the analysis of price movements and market momentum at current levels of its reversal. The robot is fully optimized and ready for use. You can use the robot if you are a beginner or an experienced trader. Just add Price Action FX to the chart.
The robot uses classic trading without risky methods such as grid, martingale and ot

FiboScalper Minimum Deposit 1000$/2 Pair= EURUSD GBPUSD Recommended Pair EURUSD,EURJPY,USDJPY,GBPUSD,GBPJPY
Timeframe H1 Parameters Lots: Number of lots Lotexponent: Martingale exponent Pipstep: number of step to open new position Maxlot: max lot use on bot Takeprofit: Take profit UseEquityStop: true if you want to use Equity Stop the bot Total EquityRisk: max drawn down by percent

This EA was created by a professional trader and developer of trading robots (more than 700 completed orders). The key advantage of this trading robot is the high risk-reward ratio, which over a period of 11 years averages from 4.2 (at the lowest risk) to 11.8 (at the highest risk) annually.
About the EA: Trading takes place on 14 currency pairs. Each strategy opens only one trade during a signal with a fixed take profit and a virtual stop loss (breaking through an extremum or a closing signal

Gold Scalping EA(MT5) - Your Path to Steady Account Growth(version1.0) Gold Scalping Focus: Targeting gold market for optimal trading opportunities. Fixed Parameters: Reliable and consistent strategy with fixed parameters( CANT BE CHANGED) ECN Account and VPS Recommended: Ensure seamless execution and minimal latency for optimal results. Ideal for Small Accounts: Perfect for a $150 account aiming for steady growth. Fixed Lot Size: 0.01 lot size for

The Smart Trend EA is fully automated trend following strategy that exploits the trend on JPY pairs. The strategy comes with slightly optimized USDJPY default settings and package of 2 different input sets that represent 2 different risk profiles that you can choose from. However it should be experimented with! This expert advisor does not use martingale, grid or similar techniques, therefore there are no spikes in the relative equity drawdown.
You can explore my full suite of EAs here: http
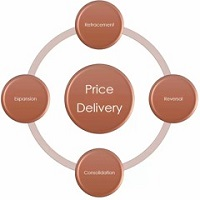
Consolidation is when price is moving inside a clear trading range. When prices are consolidated it shows the market maker placing orders on both sides of the market. This is mainly due to manipulate the un informed money. This indicator automatically identifies consolidation zones and plots them on the chart. The method of determining consolidation zones is based on pivot points and ATR, ensuring precise identification. The indicator also sends alert notifications to users when a new consolida

Achieve peace of mind with our EA companion! Simply set it and let it roll. Safeguard your trades on sluggish market days and holidays. Get updates on your balance and EA status every Friday evening, for example. Stay in the loop even if your terminal or VPS decides to take a break. Trading made easy – enjoy the tranquility! This EA has several functionalities
Closing of pending or open positions during pre-configured holidays. Automatic closing and reopening of pending positions during the nig
Expert for setting stop loss and take profit simultaneously for all orders or positions of a currency pair Once attached to the graph, the expert panel will appear on which there are buttons for setting and a green horizontal line, if you click on the line you can move it on the graph and choose the stop loss or take profit threshold with it, move the cursor over the panel and the value will be set where you have positioned the horizontal green line, press the button for the setting you want t

The Hurst Exponent gauges a time series' long-term memory and is named after Harold Edwin Hurst. The MetaTrader's Hurst Exponent Indicator analyzes an asset's price memory, helping predict future trends. It's valuable for traders of all levels, suitable for various styles like scalping or swing trading.
In Forex terms, the Hurst Exponent measures a series' dependence, indicating whether it regresses to the mean or clusters in a direction. H values between 0.5-1 suggest positive autocorrelation
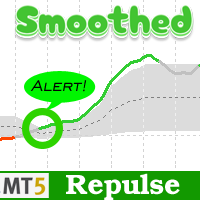
Smoothed Repulse Alert MT5 Indicator
The Smoothed Repulse Alert for MT5 is a powerful tool that visualizes market pressure through a filled area chart and two lines in a separate window. This indicator is based on the repulse indicator, assessing buying and selling pressure using high, low, open, and close prices over a specified period.
Key Features: - Customizable parameters include repulse period, moving average type, moving average multiplier, level period, upper and lower levels. - Color

This indicator builds upon the previously posted Nadaraya-Watson smoothers. Here we have created an envelope indicator based on Kernel Smoothing with integrated alerts from crosses between the price and envelope extremities. Unlike the Nadaraya-Watson estimator, this indicator follows a contrarian methodology.
Please note that by default this indicator can be subject to repainting. Users can use a non-repainting smoothing method available from the settings. The triangle labels are designed so

Elliott Wave Principle, developed by Ralph Nelson Elliott , proposes that the seemingly chaotic behaviour of the different financial markets isn’t actually chaotic. In fact the markets moves in predictable, repetitive cycles or waves and can be measured and forecast using Fibonacci numbers. These waves are a result of influence on investors from outside sources...

Version MT4: https://www.mql5.com/zh/market/product/109262 Version MT5: https://www.mql5.com/zh/market/product/109258 Instructions for use: https://www.mql5.com/zh/blogs/post/755183
EA Overview: This EA utilizes two brokers, A and B, for hedging transactions. When the ASK of broker A is smaller than that of broker B, broker A buys while broker B sells, and then observes the profits and losses of both accounts. When the total profit reaches th

This EA will capture small gold movement at night. It is based on certain sideway pattern of gold which has been persisting for many years. Tracking Account Gold Nightfall Features : No Martingale, grid or averaging. All trades have Stop Loss and Take Profit. Only one or two trades most of the time Currency: Gold/ XAUUSD Low exposure to the market, short holding time, perfect to work together with other EAs for diversification No over weekend holding Customizable risks: fixed lot, lot per x $ of

Scalping and Binary Signal Detector - Scalping indicator that gives directional signals for opening positions along the trend.
The indicator is a complete trading system that can be used for Forex and binary options.
The system of algorithms allows you to recognize intense price movements in several consecutive bars.
The indicator provides several types of alerts for arrows.
Works on any trading instruments and time frames (M5 or Higher recommended).
How to use for trading
The appearance of a

The indicator enables very quick orientation in the market phase (re/accumulation, re/distribution, up/down trend). It is counted only
from price data (without volume).
It is based on the assumptions of Wyckoff's law of Causa and Effect. Oscillations are an expression of the level of market uncertainty and point to the presence of Big Money. Such a "storm" is followed by a calmer trend that needs to be exited. You need to use other tools or shorter period of the same indicator for that.
I keep t

The expert was created to work in the Swiss bank Swissquote. Automatically calculate the volume of incoming transactions. The Expert Advisor is designed to generate passive annual income. To open a trading account in a Swiss bank, follow the link. https://trade.swissquote.ch/signup/public/form/full/fx/com/individual?lang=ru&partnerid=e9acb6ad-eb6b-44d5-92d1-4c7a48adaff1#full/fx/com/individual/step1 Notes It is recommended to register using the link for the advisor to work correctly Link

Forex traders often observe increased market activity near Supply and Demand zones, which are levels formed based on zones where strong price movements have previously occurred.
The Supply Demand Strong Weak Confirm Indicator utilizes fractals and the ATR indicator to identify and plot support and resistance zones on the price chart. These zones are categorized as follows:
- Weak: significant high and low points in the trend. - Untested: crucial turning points in the price chart that the pric
If you prefer manual trading and open multiple trades then this utility is just made for you. This is a simple utility which will close all your open trades at TP1, TP2 and TP3 by the given input percentage. NOTE: - This utility is helpful for multiple trades only (not for a single trade). You can set three Take Profit levels/targets at three Percentages to close trades partially. Inputs Explained: 1. TP 1 Pips - here you can set the first Take Profit Target in Pips for all trades combined. 2.

CAUTION: The EA is programmed for GMT+2 DST or New york closing day (EST+7 DST), like most brokers. If different contact to us.
Implementing a Seasonal Strategy for Dow Jones in 1 Hour Candlesticks entails executing buy and sell actions within the intraweek timeframe, guided by identifiable seasonal patterns on the 1-hour chart. To optimize this approach, an Expert Advisor (EA) has been integrated, incorporating advanced filters such as breaking of prices in range. This sophisticated combinat

The Black Digger Expert Advisor is specifically designed for trading on the CRUDE OIL. It is crucial to carefully consider the risk associated with each position. Due to the high daily volatility, the default settings have a wide range between Take Profit and Stop Loss. Therefore, it is advisable to set a lower risk. Regardless, the robot periodically adjusts its stop, reducing the potential risk. Platform type: MT5 Account type: Any Recommanded fx broker: InstaForex Symbol mark >> #CL.z Time

The Stock Trader is a robot crafted with a minimalist design, specifically engineered for trading on Netflix. It is intended to be part of a larger portfolio, operating alongside other systems focused on different symbols. Due to its behavior, it is advisable to set a lower volume for each individual position when determining the risk level. Essentially, the robot is designed to generate modest profits that contribute to the overall profit of the portfolio. While the robot can be utilized indepe

The expert was created to work in the Swiss bank Swissquote. Automatically calculate the volume of incoming transactions. The Expert Advisor is designed to generate passive annual income. To open a trading account in a Swiss bank, follow the link. https://trade.swissquote.ch/signup/public/form/full/fx/com/individual?lang=ru&partnerid=e9acb6ad-eb6b-44d5-92d1-4c7a48adaff1#full/fx/com/individual/step1 Notes It is recommended to register using the link for the advisor to work correctly Link

SPECIFICATIONS
Timeframe: H1(recommended) ,4H Recommended Pair: EURUSD Max drawdown: 12% (Backtested on MT5) Money management: Recommended 0.5%-1% of your capital in each trade
Broker: AnyBroker With ECN Account Supoort This version only works in Metatrader 5
MT4 version can be found here Introducing our MT5 EA:
This is a solution designed to take your investments to the next level. Forget about emotion-based decisions and market uncertainty. With our robot, you're backed by

GBPJPY Trending in 1 Hour candelsticks Strategy in GBPJPY. Robust. Follows quantitative analysis that allows for medium and long-term growth. Ideal to combine with a diversified portfolio of Forex, indices, and commodities. This strategy combines Bollinger Bands and a price pullback on an hourly candlestick timeframe. Its profitability is 18%, with a contained drawdown of 20%. However, it is also recommended to work with a portfolio of 15-20 EAs with limited risk, allowing for low drawdown and s

ROCKETSHIP Rocketship is a fully automated Expert Advisor that is built like an Institutional Trader. Rocketship recognizes Smart Money concepts like order blocks, structure, inefficient price action, Wyckoff, mitigation and liquidity. Rocketship is packed with Modifiable Inputs and Functions that you can enable, disable and optimize depending on your tolerance for Risk. Rocketship is about to make you the professional trader you’ve always dreamed of being. If you are a student of MentFX, this i
Supercharge Your Trading with HF TradeCopier !
Are you tired of manual trade execution and missed opportunities? Take your trading efficiency to new heights with the HF TradeCopier ! This cutting-edge solution empowers traders like you to effortlessly copy transactions between different MetaTrader 4 and MetaTrader 5 accounts, saving you time and maximizing your profit potential . With lightning-fast copying speeds of under 0.5 seconds , you can seize market opportunities instantly and s
Ultra KZM is an Expert Advisor that using the unique trading operation. It's strategy is based on the combination of grid and correlation system which is the new method that I invented and developed for a long time.
You can see Live Signal from these links : (delete space) 1. https: //www .myfxbook.com/portfolio/ultra-kzm-eurjpyeurchf/10224608 2. https: //www .myfxbook.com/portfolio/ea-ultra-kzm-real-account/10374382
Note that this EA should run in ECN swap-free account. When you backtest yo
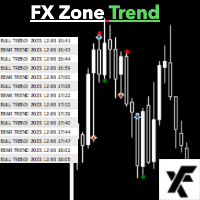
Introducing FX Zone Trend – Your Ultimate MT5 Trend Indicator!
Why FX Zone Trend? Versatile: Use it on any timeframe and pair, but optimized for USDJPY and NAS100 on the hourly timeframe. Mobile Alerts: Stay in the loop even when you're on the go! Set up notifications through MT5 and receive instant alerts on your phone. Trade Smarter. Trade with FX Zone Trend. How to Maximize FX Zone Trend: Discover the freedom to shape your trading journey: 1️⃣ Create Your Strategy: Use FX Zon

Introducing Savage Capital Max Scaling Pro – Your Go-To EA for Trading Success!
Make the most of your trading with Savage Capital Max Scaling Pro, a versatile EA for LIVE MARKETS . Key Features:
Maximize Profits Automatically: The EA places Take Profit (TP) & Stop Loss (SL) and uses a Trail Stop (TS) technique. It even collects money from running trades, even if TP isn't reached. Developed by Pros: Crafted by an experienced software developer & day-trader with years of EA development and
The MetaTrader Market is the only store where you can download a free demo trading robot for testing and optimization using historical data.
Read the application overview and reviews from other customers, download it right to your terminal and test a trading robot before you buy. Only on the MetaTrader Market you can test an application absolutely free of charge.
You are missing trading opportunities:
- Free trading apps
- Over 8,000 signals for copying
- Economic news for exploring financial markets
Registration
Log in
If you do not have an account, please register
Allow the use of cookies to log in to the MQL5.com website.
Please enable the necessary setting in your browser, otherwise you will not be able to log in.