Watch the Market tutorial videos on YouTube
How to buy а trading robot or an indicator
Run your EA on
virtual hosting
virtual hosting
Test аn indicator/trading robot before buying
Want to earn in the Market?
How to present a product for a sell-through
New Expert Advisors and Indicators for MetaTrader 5 - 105
Overview: Straddle scalper is an EA opening straddles at particular hours and /or days.
The Take Profit is dynamically generated using ATR ratio. Requirements: A hedging account is needed in order to open straddles.
A strict optimization (in open prices) is mandatory. What is a straddle ? A straddle is the action to open a Buy and a Sell at the same time. How does this EA works ? After being successfully optimized, the EA will open a straddle at each new bar (H1 Timeframe) designated by optimi

THIS EA HAD A WINRATE OF 80% !!!
How to use: The EA must be attached to ONLY one chart Symbol must be EURUSD . Timeframe should be M5. Minimum deposit 100 USD. Recommended leverage 1:50 - 1:500. The EA should run on a VPS continuously. Recommended Inputs:
Use Risk Percent: true Risk Percent: 1 Lot Size: 0.01 Target Points: 100 Magic Number: 123456789
Recommended broker: XM or any broker that has a lower spread. If you choose XM as your broker please select MT5 for trading platform type
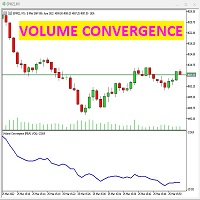
this indicator shows the strength of the real volume against the price. if the price chart and the volume trend have the same trend, it means that everything is regular. if the indicator diverges from the price chart, it means that reversal is close. when the price goes up and the "volume convergence" chart goes down, it means that money is exiting the market, sellers are selling on the rise and the price should soon start to plummet. conversely, if the "volume convergence" graph goes up while
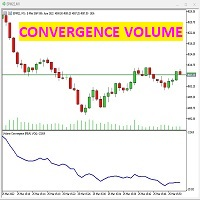
this indicator shows the strength of the real volume against the price. if the price chart and the volume trend have the same trend, it means that everything is regular. if the indicator diverges from the price chart, it means that reversal is close. when the price goes up and the "volume convergence" chart goes down, it means that money is exiting the market, sellers are selling on the rise and the price should soon start to plummet. conversely, if the "volume convergence" graph goes up while

Stargogs Spike Catcher EA V3 !!!PLEASE MESSAGE ME AFTER PURCHASING THE EA I WILL HELP AND SET IT UP FOR YOU OR I'LL SEND YOU THE RIGHT SETFILES!!! !!! IMPORTANT THIS ROBOT WON'T WORK OR MAKE PROFIT WITH DEFAULT SETTINGS!!! With The Right Settings so that you can make your daily or monthly Income. This Is the best version so far. With the right Parameters you won't fail. I will also show you the results. In Version 3.0 you can Switch on/off to Choose on which indices to catch spikes on Boom and

A deep learning neural network specially designed for the Forex market. It works on EURUSD, GBPUSD, AUDUSD, NZDUSD, USDCHF, USDCAD, USDJPY pairs. Everything is already set up. To start trading, simply set the Expert on the EURUSD H1 chart. The minimum deposit, when trading all currency pairs, is $ 150. User-friendly interface.
Monitoring of real accounts: Our products undergo mandatory testing on real accounts. At the moment, this is the only way to reliably check trading robots. Real account

For more detailed description of the inputs please enter our comunnity ( https://discord.gg/UjxeJK9SsN )
Automatic calculation of Stop Loss and Take Profit based on Volatility. You can configure 5 stops and 5 takes difereent volatilities. You can choose between a variable account (Lots gonna go up or down based on the account capital) or a fixed account based on the input. In case you want a currency conversion between account and symbol, example USD account to EUR symbol, or another currency
FREE

The Analytical cover trend indicator is a revolutionary trend trading and filtering solution with all the important features of a trend tool built into one tool! The Analytical cover indicator is good for any trader, suitable for any trader for both forex and binary options. You don’t need to configure anything, everything is perfected by time and experience, it works great during a flat and in a trend.
The Analytical cover trend indicator is a tool for technical analysis of financial markets

According to Sir Isaac Newton's 3rd law, every action has its reaction and every movement must be compensated by an opposite movement of equal magnitude. The market cannot be oblivious to this physical principle, so when the force of gravity in the market of the big sharks hides like the sun behind the horizon, the night session allows us to see this law in all its splendor. This EA takes advantage of this movement to trade in the night session . Newton´s third law is designed to operate in the
OBOS indicator
OBOS Indicator is an exclusive indicator to spot entries based on price action.
The OBOS Indicator is both effective and user friendly.
Indicator uses simple color codes and levels to indicate Overbought and Oversold conditions. No more headache.
The OBOS Indicator will only gives you indication when there are possible entries. Means you only get useful information.
Inputs of the indicator are:
MaxBars : number of bars to display in your chart Smoothing period : numb

For more support and resistance check Support and Resistance for All Market Cycles
For more details of the inputs please enter our comunnity ( https://discord.gg/GHFZkKkEBq )
High and Low of the Day Highest and Lowest Close of the Day High and Low of Previous x Bars divided by x times (Variable based on inputs) Bars Maximum represents the max of previous bars you want Progression is how much lines you want, and consecutively how often is it divided bars maximum You can pick and choose what
FREE

Tick imbalance bars (TIB), described in the book Advances in Financial Machine Learning (2018) by Marcos López de Prado. Indicator that show candlestick bars with an different sampling method than time fixed. Real time data is sourced to the indicator and it may be used as substitute of the default graph. Each bar is formed when a predefined tick balance is exceeded, showing in the graph the OHLC of this cluster of ticks. The input variable is the amount of ticks of each bar. The indicator may
FREE
This indicator shows you the time of the opening and close of the trading time of every symbol. If it's out of the trading time it will show you a message in the screen, you can choose "PT-BR" or "ENG". For future updates i want to trigger a sound alarm in the preset value by the client for the opening of positions and closement of all positions.
If you want anything more than that just message me in the community ( https://discord.gg/P5mcttvXgw ) and I will update it for you!
FREE

Assistant_for_Reopen - an Expert Advisor that helps to re-set pending orders. Many brokers force the order to expire at the end of the trading session or at the end of the trading day. Therefore, a trader has to restore all pending orders manually every time at the beginning of a new trading session. Assistant_for_Reopen frees the trader from this routine work. It controls expiration by the order expiration time and resets it if the trader ticked the checkbox. The maximum number of orders the EA
FREE
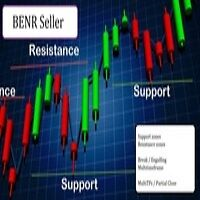
This EA allows you to manage support and resistance zones on MetaTrader 5…but not only: To your buying and selling zones (you can configure 2 sellings zones and 2 buyings zones),
you can add 3 options (2 with multiframes) to enter a position:
Option 1: this is the option that enters a position without a signal: as soon as the price reaches the zone, the robot sends a trade.
Option 2: here the robot will wait for a break in the selected timeframe. Example: you put your zones on an H4 graph

Professional robot Move reliably , which implements the classic MACD trading strategy. The signal from the intersection of the signal line with the main MACD line. When the signal line crosses the main line from top to bottom, it will be a buy signal, if the signal line crosses the main line from bottom to top, it will be a sell signal. In other cases, the absence of a signal will be recorded. Also, the signal can be inverted. The principle of operation is very simple and reliable. Gives a smal

The indicator is a trading system for AUDUSD or NZDUSD currency pairs.
The indicator was developed for time periods: M15, M30.
At the same time, it is possible to use it on other tools and time periods after testing.
"Kangaroo Forex" helps to determine the direction of the transaction, shows entry points and has an alert system.
When the price moves in the direction of the transaction, the maximum length of the movement in points is displayed.
The indicator does not redraw, all actio
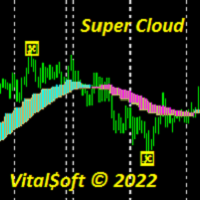
The Super Cloud indicator helps to determine the direction of the trend when trading. Shows on the chart signals about a possible upcoming trend change. The indicator provides an opportunity to detect various features and patterns in price dynamics that are invisible to the naked eye. Based on this information, traders can anticipate further price movement and adjust their strategy accordingly. Works on all timeframes except MN.

Meta Crypto Bot EA For For Binance Bot is a automatic trading Bot for Binance. EA use metatrader terminal to open trade on your Binance account. This is quantification system adopts a simple grid trading strategy, to make trade everyday. Users only need to select the corresponding investment style and click a key to start, and they can realize smart fool-style financial management. The system will intelligently match the corresponding quantification strategy according to the market situation. Cu

Trend Direction ADX indicator Trend Direction ADX is part of a serie of indicators used to characterize market conditions.
Almost any strategy only work under certain market conditions.
Therefore it is important to be able to characterize market conditions at any time: trend direction, trend strength, volatility, etc..
Trend Direction ADX is an indicator to be used to characterize trend direction:
trending up trending down ranging Trend Direction ADX is based on ADX standard indicator.

Trend Strength MA indicator Trend Strength MA is a part of a series of indicators used to characterize market conditions.
Almost any strategy only works under certain market conditions.
Therefore, it is important to be able to characterize market conditions at any time: trend direction, trend strength, volatility, etc.
Trend Strength MA is an indicator to be used to characterize trend strength:
Up extremely strong Up very strong Up strong No trend Down strong Down very strong Down extrem

Trend Direction Up Down Indicator Trend Direction Up Down is part of a series of indicators used to characterize market conditions.
Almost any strategy only works under certain market conditions.
Therefore it is important to be able to characterize market conditions at any time: trend direction, trend strength, volatility.
Trend Direction Up Down is an indicator to be used to characterize trend direction (medium term trend):
trending up trending down ranging Trend Direction Up Down is ba

Please enable this site https://openexchangerates.org/ on webrequest options on Tools -> Options -> Expert Advisors
this utility has it's function as a updater of your's database with the currency conversions of the day, all the days, and all the Currency Pairs. My Expert Advisors and Indicators who make auto calculation to show the lot take this data to guide their calculation, in relation to a account currency and a pair curreny who isn't the same as the account. Sample account in USD and

KT Coppock Curve is a modified version of the original Coppock curve published in Barron's Magazine by Edwin Coppock in 1962. The Coppock curve is a price momentum indicator used to identify the market's more prominent up and down movements.
Features
It comes with up & down arrows signifying the zero line crossovers in both directions. It uses a simplified color scheme to represent the Coppock curve in a better way. It comes with all kinds of Metatrader alerts.
Applications It can provide

A new box will be added, if the closing price is higher than the maximum (lower than the minimum) of the current box series no less than for the specified value. Reversal will be made, if the closing price is higher (lower) than the last box on a value no less than the specified.
T his is a trend indicator and it can be used as an alternative for the trend definition instruments which use averaging.
FREE

ATR MTF indicator means ATR in ALL TIME FRAMES
By running this indicator, you can see the current ATR number of all time frames on your chart, and you do not need to change the time frame .
The main ATR indicator of MetaTrader is not required anymore because by ATR MTF all your requirements to the average of the true range are solved and all ATR numbers will be shown in the optional position of the screen .
This indicator is published for free and it is forbidden to sell it to others.
I
FREE
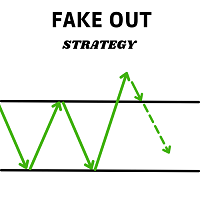
This expert advisor finds and operates the Fake out pattern, the search algorithm and its management can be adjusted from the Bot's configuration parameters.
Features: - Designed to operate with any type of asset.
- It is possible to set the time range in which the expert advisor will operate.
- Trailing stop managed internally by the algorithm.
- Partial position closing (partial profit taking), when the price has moved in favour of the position.
- Take profit automatically adjusted

show live chart spot All symbol binance If you want to get this product with a 99% discount, send a message to my Telegram admin and rent this product for 1 $ per month or 10 $ per year. Even if you do not like the way the chart is displayed, you can tell the admin in Telegram how to display it so that your own expert is ready. https://t.me/Bella_ciao1997 https://t.me/Binance_to_mql5

Alert System You use function keys to create horizontal lines for alerts. 1. Allow set horizontal line properties (line color, line style, line width, ...) for alerts. 2. Allow add text to horizotanl line. You can hide or show text when you need. You can change text and its price, but time of text will be set in input named "text_time" (0 is current time, you should test this input with -1, -2, -3 or lower). 3. It has 2 types of alert: above and bellow. You can set key to create them. If price i
FREE

KT Volume Profile shows the volume accumulation data as a histogram on the y-axis providing an ability to find out the trading activity over specified time periods and price levels.
Point of Control (POC) in a Volume Profile
POC represents a price level that coincides with the highest traded volume within the whole volume profile histogram. POC is mostly used as a support/resistance or as an essential price level where market retest before going in a specific direction.
Features Very easy

MA Alert Indicator
You do not need anymore to constantly and tediously look at the chart . If your strategy uses any type of moving average with any settings, just add this indicator to the chart according to your required settings
You will be notified whenever the price hits your MA , whether touch or candle close by crossing it. Also, an arrow symbol will be displayed on the chart based on movement.
If you d o not have access to your computer, just set your MetaTrader notification by t

Highly configurable Relative Vigor Index (RVI) indicator.
Features: Highly customizable alert functions (at levels, crosses, direction changes via email, push, sound, popup) Multi timeframe ability ( higher and lower timeframes also) Color customization (at levels, crosses, direction changes) Linear interpolation and histogram mode options Works on strategy tester in multi timeframe mode (at weekend without ticks also) Adjustable Levels Parameters:
RVI Timeframe: You can set the lower/highe
FREE

Hunt markets with Hunttern ZigZag . Easy to use with one parameter
You can use it for the following: -Classic patterns -Heads and shoulders -Harmonic patterns -Elliott Wave -Support and resistance -Supply and Demand
Single parameter: -Period (1-120)
Features: -Candle time -Single parameter -Light mode template
This is version 1 of Hunttern ZigZag. We are very happy to receive feedback from you.
FREE

My Trading History is a very useful tool for traders to know in which currency pairs, metals, indices, crypto currencies are good for trading , because this tool get all orders that made by you or EA's and organize them by symbols and tell you number of orders that you or EAs made per each symbol and show Portfolio for each symbol
You can customize the dashboard and the dashboard location on the chart as you like.
FREE

主要城市的时间。北京时间、东京时间、悉尼时间、惠灵顿时间、纽约时间、法兰克福时间、伦敦时间、迪拜时间。 城市时间可选择开启或者关闭。 点差变色提醒。设置点差提醒点数,例如,设置100点,点差大于100点,文字会变红色。 Time in major cities. Beijing time, Tokyo time, Sydney time, Wellington time, New York time, Frankfurt time, London time, Dubai time. City time can be turned on or off. Dot difference color change reminder. Set the point difference reminder points. For example, set 100 points. If the point difference is greater than 100 points, the text will turn red.
FREE

Only 5 copies of the EA at $30! Next price --> $45 This robot works on the basis of bowling band and has stepped entrances at safe points.
benefits:
Works on all instruments and time series,
It has excellent inputs for position management that can avoid a lot of risk.
Input settings:
Volume: Selects a fixed volume for the trade that uses its own risk management if it is zero.
Risk for all positions: The amount of risk for all positions in one direction,

BEHOLDD!!!!!!!
Investogenie is now in the Market. The Profound Algorithm designed in investogenie helps in scalping in the quiet time at night with a Stop Loss. The Markets conditions help the EA to decide taking the entries and exits at the proper time. Backtests and results are evident of the strength of the product.
Live results will be updated soon.
RECOMMENDATION
PAIRS: All Currency pairs
TIMEFRAME: This is Designed on M5 only
Use the set file in comment 3 or DM me
LI

DreamlinerEA Live Results: https://www.mql5.com/en/signals/1459431
DreamlinerEA MT4 version: https://www.mql5.com/en/market/product/72691 DreamlinerEA is a fully automated Expert Advisor based on the author's trading strategy. During a period of low market volatility, when liquidity is not enough for the formation of a trend and breakdown of important levels, the system trades in the Channel and use small TP values (scalping) to quickly fix profit and re-enter the market, which sign

KT Risk Reward shows the risk-reward ratio by comparing the distance between the stop-loss/take-profit level to the entry-level. The risk-reward ratio, also known as the R/R ratio, is a measure that compares the potential trade profit with loss and depicts as a ratio. It assesses the reward (take-profit) of a trade by comparing the risk (stop loss) involved in it. The relationship between the risk-reward values yields another value that determines if it is worth taking a trade or not.
Featur
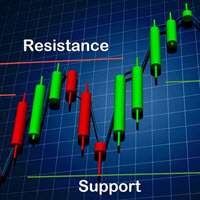
Be sure to consult with me before buying.
The robot trades based on support and resistance levels. You can use weekly and monthly times for less risk. More risk in daily and 4-hour times. Be sure to disable the robot at news times.Works on all currency pairs, indices, commodities and metals. Only observing the trade at the time of news will make this robot profitable. Automatic news management will be added in future versions.
benefits:
Works on all instruments and time series,
KT Forex Session shows the different Forex market sessions using meaningful illustration and real-time alerts. Forex is one of the world's largest financial market, which is open 24 hours a day, 5 days a week. However, that doesn't mean it operates uniformly throughout the day.
Features
Lightly coded indicator to show the forex market sessions without using massive resources. It provides all kinds of Metatrader alerts when a new session starts. Fully customizable.
Forex Session Timings I
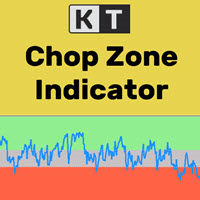
It's a well-known fact that most of the financial markets trend only 30% of the time while moving in a closed range rest 70% of the time. However, most beginner traders find it difficult to see whether the markets are trending or stuck in a range. KT Chop Zone solves this problem by explicitly highlighting the market phase into three zones as Bearish Zone, Bullish Zone, and Chop Zone.
Features
Instantly improve your trading by avoiding trade during the sideways market (Chop Zone). You can al

KT Absolute Strength measures and plots the absolute strength of the instrument's price action in a histogram form. It combines the moving average and histogram for a meaningful illustration. It supports two modes for the histogram calculation, i.e., it can be calculated using RSI and Stochastic both. However, for more dynamic analysis, RSI mode is always preferred.
Buy Entry
When the Absolute Strength histogram turns green and also it's higher than the previous red column.
Sell Entry
W

KT Custom High Low shows the most recent highs/lows by fetching the data points from multi-timeframes and then projecting them on a single chart. If two or more highs/lows are found at the same price, they are merged into a single level to declutter the charts.
Features
It is built with a sorting algorithm that declutters the charts by merging the duplicate values into a single value. Get Highs/Lows from multiple timeframes on a single chart without any fuss. Provide alerts when the current

Petani Uanx MT5 - is a Integrated Pair Expert Advisor. this is Multi-Currency(MultiPair) EA, Dynamic Trading Logic, and has a profit or loss security Only for purchase now for$199! Next price --> $499
The main strategy uses scalping at the speed of candles per second, the system only focuses on Small and Stable Profits. EA can use Hedging, Martingale, or and not use other dangerous strategies. It uses a fixed stop loss for each position or closed orders integrated with all open
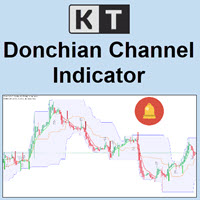
KT Donchian Channel is an advanced version of the famous Donchian channel first developed by Richard Donchian. It consists of three bands based on the moving average of last high and low prices. Upper Band: Highest price over last n period. Lower Band: Lowest price over last n period. Middle Band: The average of upper and lower band (Upper Band + Lower Band) / 2. Where n is 20 or a custom period value is chosen by the trader.
Features
A straightforward implementation of the Donchian channel

KT Auto Trendline draws the upper and lower trendlines automatically using the last two significant swing highs/lows. Trendline anchor points are found by plotting the ZigZag over X number of bars.
Features
No guesswork requires. It instantly draws the notable trendlines without any uncertainty. Each trendline is extended with its corresponding rays, which helps determine the area of breakout/reversal. It can draw two separate upper and lower trendlines simultaneously. It works on all timefr

KT Inside Bar plots the famous inside bar pattern in which the bar carries a lower high and higher low compared to the previous bar. The last bar is also known as the mother bar. On smaller time-frames, the inside bar sometimes appears similar to a triangle pattern.
Features
Also plots entry, stop-loss, and take-profit levels with the inside bar pattern. No complex inputs and settings. Erase unwanted levels when the price reaches the entry line in either direction. All Metatrader alerts incl

KT ROC divergence shows the regular and hidden divergences build between the price and Rate of change oscillator. Rate of change (ROC) is a pure momentum oscillator that calculates the change of percentage in price from one period to another. It compares the current price with the price "n" periods ago. ROC = [(Close - Close n periods ago) / (Close n periods ago)] * 100 There is an interesting phenomenon associated with ROC oscillator. In ROC territory there is no upward limit, but there is a do
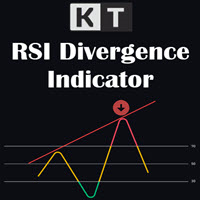
KT RSI Divergence shows the regular and hidden divergences built between the price and Relative Strength Index (RSI) oscillator. Divergence can depict the upcoming price reversal, but manually spotting the divergence between price and oscillator is not an easy task.
Features
Ability to choose the alerts only for the divergences that occur within an overbought/oversold level. Unsymmetrical divergences are discarded for better accuracy and lesser clutter. Support trading strategies for trend r

Crypto Suite EA MT5 - Is a fully automated Expert Advisor, which have been designed at author's trading strategy for Crypto trading. Crypto Suite EA MT5 determines market volatility and momentum with the Standard Deviation indicator. Also EA use such technical indicators as: Standard Deviation to determine the price deviation, CCI, Stochastic and Moving Average to determine the trend. Based on the characteristics of the cryptocurrency market and the long-term upward trend, the system is designe

Get a free complementary EA after your purchase! Contact me and ill provide it for you.
MT4 Version: https://www.mql5.com/en/market/product/79684 Minimum deposit is 1000$ , or 1000 Cent = 10$. (Recommended 1500$) Every 1000$ = 0.01 Lot. Please stick to the rules, as we want you to win, win and win! (Trading is risky, and there are no guarantees for winning)
Time frame: M1
Leverage : Higher the bette

Best indicator for MT5 providing accurate and sniper signals to enter a trade without repainting!
It can be applied to any financial assets: forex, synthetic, cryptocurrencies, metals, stocks, indices . It will provide pretty accurate trading signals and tell you when it's best to open a trade and close it. Most traders improve their trading results during the first trading week with the help of the Power Indicator Pro.
Benefits of the Power Indicator Pro
Entry signals without repa
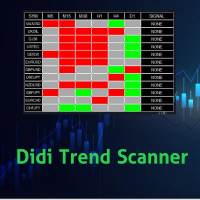
Didi Trend Scanner is an indicator for scanning market watch and detect market direction for each Time Frames and give signals for each pair
You can make decision of making trades by this scanner that specify market trend direction for you For each time frame you can add and remove any pairs you want to scan the scanner send alert via push notifications and email

Get a free complementary EA after your purchase! Contact me and ill provide it for you.
MT4 Version: https://www.mql5.com/en/market/product/79715 Minimum deposit is 1000$ , or 1000 Cent = 10$. (Recommended 1500$) Every 1000$ = 0.01 Lot. Please stick to the rules, as we want you to win, win and win! (Trading is risky, and there are no guarantees for winning)
Time frame: M1
Leverage : Higher the bette
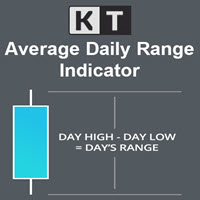
KT Average Daily Range(ADR) shows the upper and lower levels using the average daily range covered by the currency pair or the instrument. The average daily range is calculated using the chosen period in the input settings. ADR High: ADR upper level is found by adding the average daily range value to the current day's low.
ADR Low: ADR lower level is found by subtracting the ADR value from the current day's high.
Features
It shows the ADR levels with several other helpful information bene

EA PRO is a 100% adaptive expert advisor based on price action, indicators and chart patterns. It has a built-in unique Smart Recovery algorithm which insures that your win rate is higher and that you recover your losses. Number of trades and lot size is decided by EA so that you get the most rewards from each trade. Every trade can be set with Stop loss and Take profit, the EA has an active trailing stop which is automatically activated once your trade is in profit. The EA can scalp the spikes

Парный трейдинг по-прежнему остается самым безопасным видом трейдинга. В советнике используется интересный информационный индикатор, который показывает силу тренда на конкретной паре в процентах. Также применяются другие индикаторы. Пример на скриншоте. На EURUSD сила бычьего тренда 78%. На USDCHF сила бычьего тренда 70%. Советник открывает позиции на обоих инструментах на sell одинаковым лотом. Закрывает когда числовые значения силы тренда обоих инструментов немного подравнялись, чтобы был пол

If you want to find good trading opportunities, then you must trade near the Trend Line. This allows you to have a tighter stop loss on your trades — which improves your risk to reward . But that’s not all… Because if you combine Trend Line with Support and Resistance, that’s where you find the best trading opportunities. Now you might wonder: “So when do I enter a trade?” Well, you can use reversal candlestick patterns (like the Hammer, Bullish Engulfing, etc.) as your e
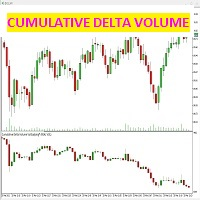
this indicator detects the difference between the contracts struck in bid and in ask (aggression) for each single candle.
the indicator shows in the dedicated window below the price chart, candles given precisely by the difference between the contracts sold and purchased, which generate the volumetric strength of the market.
it is possible (see from the screenshots) how to select only the cumulative candlestick delta chart, or even with a trendline of the candles themselves: by selecting th

Traders Toolbox Overwatch - is a monitoring utility for all Traders Toolbox running instances.
It a simple chart switching utility and a market watch for all Traders Toolbox Running charts.
Features: 1. Customisable Button Colours, Rows and Columns. 2. Three Signal Types (Hold - Yellow / Sell - Red / Buy - Green) 3. Dynamically Updates button list depending on new or closed instances of Traders Toolbox 4. Single Click Buttons bring related chart to foreground. 5. Buy and Sell Signals s

Magic Night is an automated trading system that uses a channel indicator and candlestick patterns to open and close trades.
Trades every day at a specific time.
Doesn't use grid, martingale or other dangerous money management methods.
Timeframe М5, currency pairs EURAUD, EURCAD, GBPCAD, GBPUSD Minimum deposit 70 usd.
Live signal https://www.mql5.com
Instructions for installing https://Blogs Magic Night
Download set files https://Sets Magic Night
Settings EA Order_Comment - Orde

Easy Trend , as the name implies, is an indicator that easily shows the prevailing trend by bringing several indicators into one. The strategy is: when all indicators point in the same direction a signal is triggered. When red, is a signal to sell, when blue, signal to buy. It is that simple :) There are a total of 9 indicators: Moving Average, RSI, CCI, Parabolic SAR, William's Range, Stochastic, MACD, ADX and Heiken Ashi. It is possible to configure each of these indicators to suit your way of

Buy Sell Signal Low TF gives buy/sell signals and alerts with up and down arrow at potential reversal of a pullback or a trend continuation pattern in low timeframe. This is an indicator which gives signals based on trend => It works best in trend market with the principle is to ride on the trend not trade against the trend.
The components of Buy Sell Signal Low TF: - The trend is determined by SMMA 13 , SMMA 21 and SMMA 35 ( can be changed manually to suit your preference). - The signal is
FREE
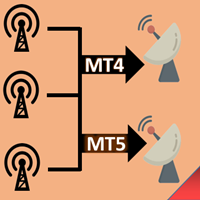
EASY : Simple to use, just load and select the signal source or receiver to use it easily FAST: fast copy orders, algorithm optimal copying mechanism, priority calculation of new signals, priority queue processing to receive special signals Multiple: 1. Supports sending multiple signals at the same time, selecting multiple accounts for multiple accounts to copy at the same time 2. Supporting multiple platforms, MT4 and MT5 are interoperable. Copier: easy and fast multiple accounts copy lot

The True Oversold Overbought indicator provides you with ability to swiftly check whether the asset is oversold or overbought. Other than complementing your trading with True Oversold Overbought, you can use the indicator as your only trading system. It works with all forex instruments and will save you the headache of estimating when the market is due for a reversal or retracement. When the "Super Charge" feature is enabled, the areas where the price is in oversold/overbought status are ampli

[ MT4 Version ] Advanced Bollinger Bands RSI EA MT5 Advanced Bollinger Bands RSI EA is an Expert Advisor based on the worldwide known strategy BB & RSI. This strategy uses the Bollinger Bands indicator in combination with the RSI, the signal triggers only when both the BB and the RSI indicate at the same time overbought or oversold conditions. Both indicators make a great combination to anticipate big explosive moves. Advanced Bollinger Bands RSI EA grants the user the posibity to use 3 differen
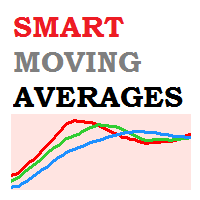
Smart Moving Averages Indicator Smart Moving Averages is an exclusive indicator for Metatrader platform.
Instead of calculating moving averages for the selected chart time frame, the Smart Moving Averages indicator gives you the opportunity to calculate moving averages independently from the chart time frame.
For instance you can display a 200 days moving average in a H1 chart.
Inputs of the indicator are:
Timeframe : timeframe to be used for the calculation of the moving average Perio

Bar Strength Divergence Indicator BarStrength Indicator is an exclusive indicator to trade Forex, Stocks, Indices, Futures, Commodities and Cryptos.
BarStrength Indicator shows the strength of each candle.
The indicator shows in a separate windows candles relatively to 2 price levels representing resistance and support in the market.
Once candle is near resistance it is highly probable that price movement will change direction and will go down in the next candles.
Once candle is near sup

Good afternoon, dear traders! I am glad to present you my new trading system - Cat Scalper MT5! The launch price of the EA is now reduced! Last week of discounted prices! The adviser's strategy is evening trading using a dynamic channel. The EA trades one trade using stop loss and take profit. Multicurrency Expert Advisor. You can test your symbols by entering their names in the parameters. I recommend using the default settings. The working timeframe (including for tests) is M15 only!
The MetaTrader Market is the only store where you can download a free demo trading robot for testing and optimization using historical data.
Read the application overview and reviews from other customers, download it right to your terminal and test a trading robot before you buy. Only on the MetaTrader Market you can test an application absolutely free of charge.
You are missing trading opportunities:
- Free trading apps
- Over 8,000 signals for copying
- Economic news for exploring financial markets
Registration
Log in
If you do not have an account, please register
Allow the use of cookies to log in to the MQL5.com website.
Please enable the necessary setting in your browser, otherwise you will not be able to log in.