Watch the Market tutorial videos on YouTube
How to buy а trading robot or an indicator
Run your EA on
virtual hosting
virtual hosting
Test аn indicator/trading robot before buying
Want to earn in the Market?
How to present a product for a sell-through
Technical Indicators for MetaTrader 5 - 10

Simple ATR (Average True Range) Channel to find your Stop Loss and/or Take Profit. Indicator allows to draw a second multiplier if you need different values for SL and TP. Leave the second multiplier to 0 if not used.
Settings + Length
+ Smoothing
+ Multiplier #1 (default 1.5)
+ Multiplier #2 (set to 0 if not used)
+ High price
+ Low price
+ show price line
+ colors can be changed
Please leave wishes in the comments. Reviews are also welcome.
FREE
Candlestick coloring indicator based on the crossing of two moving averages. The crossing of the fast average with the slow average defines a possible beginning of the trend and the indicator will color the candles according to the trend, high or low.
It is possible to define the period, calculation method, offset, and price of the two moving averages, which makes the indicator very customizable.
FREE

Trading Session Indicator for MT5 This Session Indicator for MT5 visually highlights key trading sessions directly on your chart with customized colors, making it easier to track market movements during different time zones. The indicator automatically detects and displays the Asian, European, and US trading sessions, offering clear visual separation for each session using user-defined color schemes. Key Features: Automatically plots the major trading sessions (Asian, European, and US) on the ch
FREE

Draw and Sync Objects Multiple Charts 1. Draw objects by key press. ( You must: 1. Press Function key => 2. Click where you want to draw => 3. Draw it => 4. Press ESC to complete). (If you don't want to draw after pressing function key, you must press ESC to cancel). 2. Developing : Sync selected objects to multiple charts by button. 3. Developing: Hide objects that do not belong to the current symbol (Objects drawn with this indicator will belong to the symbol they are plotted on. When your c
FREE

Developed by Jack Hutson in the 80's, the Triple Exponential Moving Average (a.k.a. TRIX ) is a Momentum technical indicator that shows the percentage of change in a moving average that has been smoothed exponentially 3 times. The smoothing process was put in place in order to filter out price movements that are considered insignificant for the analysis period chosen. We at Minions Labs found hard to follow the smoothness of the original TRIX line, so we colored the TRIX line with BUY and SELL t
FREE

Finally a Metatrader version of the very popular (and expensive) Market Cipher B indicator, or the Vumanchu Cipher B + Divergences very popular on Tradingview platform.
This tool is very heavy on calculations, total are 31 plots using 97 buffers from several indicators. On my mid end computer, timeframes below M15 start getting a bit laggy, so it would require a powerful computer to run it properly at very low timeframes. It's still usable here, but somewhat sluggish response in Metatrader (l
FREE

The indicator synchronizes eight types of markings on several charts of one trading instrument.
This indicator is convenient to use in conjunction with "Multichart Dashboard" or other similar assistant that allows you to work with several charts at the same time.
"Multichart Dashboard" can be found under the link on my youtube channel.
Settings:
enable vertical line synchronization
enable horizontal line synchronization
enable Trend Line synchronization
enabling Fibonacci Retracement
FREE

SETTINGS Make sure to select Chart shift option in the chart.
(Right click in the chart ---> Properties (dialog box) ----> Select Chart Shift)
Kindly rate and comment about the product for upgradation & Support
When using candlestick timers, keep in mind that the timing of candlestick patterns can play a crucial role in your trading strategy. For instance, different timeframes (such as 1-minute, 5-minute, hourly, ) can provide varying insights into price movements and trends. Make sure t
FREE
Ratio Indicator - User Guide This Ratio indicator allows you to monitor and trade the price relationship between two selected assets. It calculates the ratio of the prices of two assets, known as Asset1 and Asset2 (for example, "PRIO3" and "PETR3"), and plots a moving average of the ratio, along with Bollinger Bands . These bands are used to identify ideal entry and exit points, especially in correlated assets, enabling an arbitrage approach. How the Indicator Works Bollinger Bands on the Ratio:
FREE

Tyr Bands Indicator (IC MARKETS GOLD). Just drag and drop. This indicators gets you entry points for the market. it is for gold, but you can configure for any other currency. Tyr Band works with BB and 3 different deviations, plus the Stochastic confirmation. So when the price closes below/above the BB Reversal Band (Red) and the Stochcastic is in the confirmation zone, then the arrow (buy/sell) appears. This arrow indicates that we can entry to the market up/down on the next opening. Since it i
FREE

"Introducing NakaTrend: Your Ultimate Trend Detector for MetaTrader 5!
Ready to revolutionize your trading experience? Meet NakaTrend, your go-to indicator for identifying trend changes with precision and ease.
With NakaTrend, you'll never miss another opportunity to capitalize on market shifts. When a bullish trend emerges, NakaTrend signals it with a green dollar sign, prompting you to enter a buy order. And when the tide turns bearish, a red dollar sign appears, signaling the perfect mom
FREE

The indicator shows Profit Zones on the chart, displaying the beginning and end of the local trend Profit Zone PRO is perfect for all Meta Trader symbols: currencies, metals, cryptocurrencies, stocks and indices
Advantages of the Profit Zone PRO indicator:
Input signals without redrawing The algorithms of the indicator allow you to find the ideal moments to enter a transaction (purchase or sale of an asset), which increase the success of transactions for 100% of traders. The indicator has t
FREE

Combining the best of Price Action , Directional Movement , and Divergence/Convergence analysis, Candle Color Trend is a easy and reliable way to identify trend direction. The indicator automatically paints the candles according to the assumption that an uptrend is defined by prices that form a series of higher highs and higher lows. In contrast, a downtrend is defined by prices that form a series of lower highs and lower lows. Additionally, ADX Wilder indicator is used to measure trend weakness
FREE
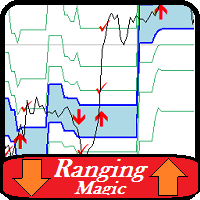
This is a powerful indicator that is very easy to work with. Its default setting is for the euro-dollar pair, but with the right settings it can be used in all markets and all time frames less than daily. The basis of the work of the Ranging indicator is to find areas of price range and get signals from it. You can specify the duration of the valid sufferings and the minimum and maximum price in it. It is also possible to determine the number of reliable signals received from each range.
Othe

Daily VWAP Indicator (Volume Weighted Average Price) Description The Daily VWAP (Volume Weighted Average Price) indicator calculates the average price of an asset each trading day, weighted by trading volume. Used extensively by institutional and professional traders, the Daily VWAP is a key reference point for identifying the average price trend based on trade volume, making it a powerful indicator for buy and sell decisions. How Does It Work? The Daily VWAP calculates the volume-weighted avera
FREE
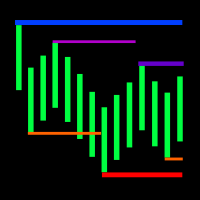
The indicator displays the fractal levels of one, two or three different higher timeframes starting beginning with the current one. When a new fractal appears, a new level is plotted. The indicator can be used for visual analysis of the current chart and applied in an EA. If more levels are needed, start a new instance of the indicator.
Features The indicator works on any timeframe and symbol. If a timeframe smaller than the current one is selected in the settings, the level of the current tim

The Expert Advisor for this Indicator can be found here: https://www.mql5.com/en/market/product/115567 The Contraction/Expansion Breakout Lines with Fair Value Gaps (FVGs) Indicator for MetaTrader 5 (MT5) is a powerful technical analysis tool designed to help traders identify and visualize breakouts at critical levels of contraction and expansion in financial markets. By incorporating Fair Value Gaps (FVGs), this indicator enhances traders' ability to gauge market sentiment and anticipate poten
FREE

RS Zone is an Indicator used to plot the support and resistance levels of each asset. and each time period as we determine The principle for calculating support and resistance levels is based on the price range (Range SR) to see if there are points where the price repeatedly reverses at that price level or not. The total pot will be equal to the Total SR that we set. Example If Range SR is equal to 120, the system will choose to look at data going back 120 candlesticks to find whether there is a
FREE

The ATR Exit indicator uses the candle close + ATR value to draw trailing stop lines (orange under buys, magenta over sells) that advance with the trend until the trend changes direction. It uses a multiple of the Average True Range (ATR), subtracting it’s value from the close on buy, adding its value to the close on sell. Moreover, the trailing stop lines are generated to support the order’s trend direction (long or short): In an upward trend, the long trailing stop line (orange line under bu
FREE

The Fair Value Gap Detector is a MetaTrader 5 indicator designed to identify and draw rectangles on the chart wherever fair value gaps (FVGs) are detected. Fair value gaps occur when there is a significant disparity between the current price and the fair value of an asset. These gaps can provide valuable insights into potential trading opportunities, as they often indicate overbought or oversold conditions in the market. Key Features: FVG Detection: The indicator utilizes a proprietary algorith
FREE

This is the Cumulative Volume Delta (CVD) , it's an indicator that calculates the long and short volumes plotting it then as a line on the chart, the most efficient way to use this indicator is by comparing the CVD line to the current chart and looking at the Divergence beetween the two of them, so that you can identify fake-outs and liquidty sweeps. for example in the picture that i put below you can see that the price has made a lower low but the CVD didn't, that means the volumes didn't suppo
FREE

Introducing the AI Keltner Channel , a cutting-edge Forex indicator that leverages machine learning to dynamically calculate Keltner Channels in real-time. Unlike traditional Keltner Channel indicators, which rely on static inputs, the AI Keltner Channel adapts continuously to ever-changing market conditions, providing traders with a more accurate and responsive view of price trends and volatility. Powered by advanced machine learning algorithms, the AI Keltner Channel analyzes historical and re
FREE

Join Koala Trading Solution Channel in mql5 community to find out the latest signals, news about all koala products, join link is below : https://www.mql5.com/en/channels/koalatradingsolution
Koala BTC Level Indicator Introduction
This indicator made for who love to buy BTC, as you know BTC was one of the best investment items in last years and also these days, so this indicator just show us buy levels for bit coin. Koala BTC Level indicator can determine lowest points according depth par
FREE

Moving Average Convergence/Divergence — схождение/расхождение скользящих средних — технический индикатор, разработанный Джеральдом Аппелем (Gerald Appel), используемый в техническом анализе для проверки силы и направления тренда, а также определения разворотных точек. Встроенный в MetaTrader 5 индикатор MACD не соответствует задумке автора (Gerald Appel):
-линия MACD графически изображена в виде гистограммы, однако гистограммой отражается разница между линией MACD и сигнальной линией;
-сигнал
FREE

StopLevel The meter controls the STOPLEVEL level. When the level changes, it signals with an alert. STOPLEVEL - the minimum offset in points from the current closing price for placing Stop orders, or the minimum allowable stop loss / take profit level in points. A zero value of STOPLEVEL means either the absence of a restriction on the minimum distance for stop loss / take profit, or the fact that the trading server uses external mechanisms for dynamic level control that cannot be transmitte
FREE

Certainly! Let me introduce you to a powerful tool for MetaTrader 5 (MT5) that can automatically identify and draw support and resistance (S&R) levels on your trading charts. This tool is called the “Support and Resistance Levels Guru” . Support Resistance Levels Guru The Support & Resistance Indicator automatically displays essential S&R levels on your chart. These levels are crucial for technical analysis and are used by many traders. Resistance levels (zones) are shown in R ed , while suppo
FREE

Cybertrade ATR Trend Zone - MT5 The indicator shows, by calculating the ATR (Average True Range), the zone of probable price resistance. Indicated to be used as a probable exit point of an operation.
It works on periods longer than the period visible on the chart. All values are available in the form of buffers to simplify possible automations. This indicator is the same one we use in our EA. Also check out our other products.
FREE

The TTM Squeeze is a trading strategy developed by John Carter of Trade the Markets that uses the combination of Bollinger Bands and Keltner Channels to identify periods of low volatility, followed by periods of high volatility. The strategy is based on the principle that low volatility periods are typically followed by high volatility periods and is used to identify potential trading opportunities. When the Bollinger Bands move inside the Keltner Channels, it is referred to as a squeeze, and i
FREE

MomoPoints is an indicator that shows long and short entry/add points on the chart.
Based on momentum and trend strength, MomoPoints show entries/adds with a good risk to reward ratio.
Settings
----------------------------------
Design: Colors, size and wingdings (graphic symbol) of the signal can be adjusted.
Signal Settings: Moving average period, trend strength, distance from moving average to price and RSI period can be set.
Signal values can be displayed as a comment to set th
FREE

Price Sessions is an exclusive MetaTrader 5 indicator that integrates symbol information and trading sessions into your chart. It does not link to any account information or external sources, ensuring user safety. Main Features: 1. Symbol Information Current Symbol Live Price Live Spread 2. Trading Sessions (Time zone UTC/GMT+0) Tokyo session London session New York session If you find this utility helpful, please rate it. If you encounter any issues or have suggestions, pleas
FREE

This indicator calculates the volume profile and places labels that correspond to the VAH, VAL and POC levels, for each candle individually.
Indicator operation features The indicator works on the timeframes from M3 to MN, but it uses the history data of smaller periods: M1 - for periods from M3 to H1, M5 - for periods from H2 to H12, M30 - for the D1 period, H4 - for the W1 period, D1 - for the MN period. The color and location of the VAL, VAH and POC labels on the current candle are consider
FREE

John Bollinger created this indicator in 2010 as a way to read the original indicator (Bollinger Bands) in a more "technical" way, shown as an oscillator. The typical range of the Bollinger Bands %B is 0 - 0.5 - 1.0, where "0" represents the lower band, the "0.5" the middle band, and "1" the upper band. The line on the indicator represents the Closing prices. As simple as that.
SETTINGS
Bollinger Bands period of analysis Standard Deviation multiplier Shift Price type to be analyzed
If you
FREE

Automatic Trend Line Fit. This indicator automatically plots the straight line and parabolic (curved) trend to any symbol at any timeframe. The plotted straight line is a good indication of the current trend and the curved line is an indication of a change momentum or change in the current trend. Plotting the straight line over about 2/3 the number of candles as the curved line is usually a good way to determine entry and exit points as it shows the current trend and momentum of the market. This
FREE

Gold TL MTF - this is a fine stock technical indicator. The indicator algorithm analyzes the movement of the asset price and reflects trend lines along the fractals of a specific timeframe (TF).
Benefits of the indicator: The indicator produces signals with high accuracy. The confirmed signal of the indicator does not disappear and is not redrawn. You can trade on the MetaTrader 5 trading platform of any broker. You can trade any assets (currencies, metals, cryptocurrencies, stocks, indices
FREE

Welcome to Propsense, the best solution for new and veteran traders with a simple FREE strategy! NEW to MT5! This indicator is a unique and affordable trading tool built on the teachings of a former bank trader. With this tool, you will be able to see inefficient points with ease. Additionally, traders will have a clean Heads Up Display which will show your running and closed P/L in pips AND currency units. As a highly requested option, a candle timer has been added which will allow you to j
A Renko Tick chart based on continuously adjusting percentage.
Live Renko bricks formed by tick data
Adjustable brick width expert for indicator attached Scalp with a Renko, get weird.
The settings can and will break the script if you turn them up too high. Turning off outline mode will not look as nice, but can potentially allow for a larger number of bricks.
FREE

The big figure is a crucial aspect of forex trading, serving as a reference point for trade execution, risk management, and technical analysis. By understanding the importance of the big figure and incorporating it into their trading strategies, forex traders can improve their decision-making process and increase the likelihood of successful trades. Why is the Big Figure Important? The big figure is important for several reasons: Simplification: Traders often refer to the big figure when discu
FREE
The indicator that shows the countdown to the change of candles is equipped with an alert when the bar changes (the alert is not active if installed on the M1 time frame). Displays seconds if installed in time frame M1, displays minutes and seconds if installed in time frame above M1, and displays hours and minutes if installed in time frame h1 and above. The time displayed is calculated based on the running time.
FREE

MT4 Version Fibonacci Bollinger Bands MT5 Fibonacci Bollinger Bands is a highly customizable indicator that shows areas of support and resistance. This indicator combines the logic for the Bollinger Bands with the Fibonacci level. Fibonacci Bollinger Bands is the first indicator in the market that allows the user to 100% customize up to 12 Fibonacci levels, the Moving Average type and the price data source to use for the calculations. This flexibility makes the Fibonacci Bollinger Bands easily
FREE
This indicator is the mql version of the Linear Regression Candles indicator. There are many linear regression indicators out there, most of them draw lines or channels, but this one actually draws a chart.This script includes features such as linear regression for open, high, low, and close prices, signal smoothing with simple or exponential moving averages. I welcome your suggestion for improving the indicator
To increase the loading speed of any indicator:
Reduce the max bars in chart
FREE

Daily session open lines shows the traders three important trading session opens. By default it is set up to show you: Zero GMT Open Line London Open Session Line New York Open Session Line The default times are set according to GMT+2 and as such you are able to change and customise according to your specific time zone. The Indicator is usefull specially for the trader who trades the London and NewYork sessions.
FREE

Key Price Levels Indicator Indicator that shows the highs and lows for the significant price levels for past periods that could be potentially considered as reaction levels. The indicator displays the following price levels: Yesterday high and low The day before yesterday high and low Two days back high and low Last week high and low Last month high and low Last three month high and low (Quarter) Last year high and low
FREE

This indicator created based on original John Carter's TTM_Squeeze indicator and represents "squeeze" of the market which can be followed (or maybe not) by significant moves. Original indicator prints black dots when Bollinger Bands are inside Kelthner Channels and exactly this implemented in this custom version. Instead of original implementation as momentum indicator MACD indicator with standard settings 12-26-9 is being used. Mainly, the indicator is useful for understanding when it's better
FREE

Indicator Introduction: The indicator comes from network ,It is more stable relative to RSI or CCI. You can set the indicator to send emails/notifications/alerts when the previous bar has an up or down arrow, you can specify the text of emails by inputing string into the parameter box of "UpMessages/DownMessages". It can be used to analyze market trend and design new expert that is based on trend. If the indicator below the axis ,this is a buy zone. The trend indicator is suitable for M1 and ab
FREE

The Candle Countdown Timer for MetaTrader 4 (also available for MT5) is a vital indicator designed to help you manage your trading time effectively. It keeps you updated about market open and close times by displaying the remaining time before the current candle closes and a new one forms. This powerful tool enables you to make well-informed trading decisions. Key Features: Asia Range: Comes with an option to extend the range. Broker Time, New York, London Time: Displays the current broker time
FREE

The outside bar indicator shows a range of inside bars and the breakout up and down from the range. The breakout is always displayed at the start of a new range and is extended until another breakout. The calculation always takes place at the start of a new candle. So it is displayed accordingly in all time frames. In inside bar ( insidebar ) trading you can see the top and bottom of a range.
In outside bar ( outsidebar ) trading, the breakout from a range and thus the trend following.
The c
FREE

XE Forex Strengh Indicator MT5 displays visual information about direction and strength of a signal for current pair and chosen timeframes (M5, M15, M30 and H1). Calculations are based on multiple factors and results are shown as a colored panel with scale bar, numerical values and arrows. There are also displayed values of current price and spread on the pair. There can be activated an alert (as a mail or pop-up window with sound) for each available timeframes which send a message when the dir
FREE

White label available. contact us for more info. dushshantharajkumar@gmail.com
Chart Walker Smart Lines (CWSL) by Chart Walker Smart Lines is a MetaTrader 5 (MT5) indicator that revolutionizes technical analysis by offering a suite of powerful features to enhance your trading experience. This intelligent tool is designed to automate various aspects of chart analysis, providing traders with valuable insights and saving time on manual tasks. Key Features Automatic Channel Drawing: Smart Line
FREE

MT4 Version Available Here: https://www.mql5.com/en/market/product/43555
Telegram Channel & Group : https://t.me/bluedigitsfx
V.I.P Group Access: Send Payment Proof to our Inbox
Recommended Broker: https://eb4.app/BDFXOsprey *All In One System Indicator, Breakthrough solution for any Newbie or Expert Trader! The BlueDigitsFx Easy 123 System makes it easy to identify important areas of market structure. It alerts you to changes in market structure which typically occur when a revers

Introduction
The RSI Plus is an innovative technical analysis tool designed to measure the strength and direction of the market trend. Unlike the traditional RSI indicator, the RSI Plus boasts a distinctive ability to adapt and respond to market volatility, while still minimizing the effects of minor, short-term market fluctuations.
Signal
Buy when the RSI plus has been in the oversold (red) zone some time and it crosses above the 20 level on previous candle close
Sell when the RSI
FREE

This Mt5 Indicator Signals when there is two opposite direction bars engulfed by current bar. has a recent Exponential Moving Average Cross and past bar was oversold/bought Expert Advisor Available in Comments Free Version Here : https://www.mql5.com/en/market/product/110114?source=Site  ; Full Alerts for mt5 terminal , phone , email, print to file, print to journal Buy Signal ( blue line ) Past ema cross ( set at 30 bars back ) Past bar rsi is oversold ( level 40 ) Engulfing bar closes
FREE

Jackson Support and Resistance V it a powerful advance support and resistance indicator which provide signal base on price action, it Design to make things easy for everyone to draw support and resistance. we believe most strategies are built with support and resistance as a foundation .Having support and resistance perfect can be a game change to you way of trading. It flexible to all instrument .don't forget to watch our video on how to us this indicator prefect and progressive.
FREE

The indicator displays important technical levels on the chart. These levels act as support or resistance for the price movement.
The most important levels are multiples of 100 and 50 pips . You can also display levels in multiples of 25 pips .
When the price reaches the level, an alert or push notification is displayed. MT4 version https://www.mql5.com/en/market/product/69486 Settings Show Levels 100 pips - show levels that are multiples of 100 pips Show Levels 50 pips - show levels
FREE

Introducing the Quasimodo Genie, a powerful indicator for MetaTrader 5 that automatically identifies the Quasimodo or Over and Under pattern. This indicator is perfect for traders who want to take advantage of this popular chart pattern and make profitable trades. With the Quasimodo Genie, you can easily find the best swing points for the Quasimodo pattern and place virtual trades with stop loss and take profit levels. The Quasimodo Genie is easy to use and comes with a range of customizable set
FREE

The "Rejection Block" MetaTrader 5 Indicator offers traders a comprehensive tool for identifying and visualizing rejection candlestick patterns, commonly known as rejection blocks. These patterns are pivotal in discerning potential market reversals or continuations, making them invaluable for traders seeking to enhance their analysis. Key Features: Rejection Block Detection: The indicator diligently scans price data, pinpointing instances of rejection candlestick patterns. These patterns typical
FREE

Clock GMT Live has everything you need to know more about our broker, many times you will have wondered what gmt I am on or what gmt my broker is working on, well with this tool you will be able to know in real time both the GMT time offset of the broker and of your local time, you will also constantly know the ping of the broker Just by placing it at a time of day you can get the information
The price increases for each acquisition, with this we will protect so that few can have my unique st
FREE

Volume pressure and oscillator overbougth - oversold condition togedther. Signals appears on chart. Turnig points, trading ranges, support- resistance levels also. Change parameters in the trendscalp settings. TTF bars can be set: 8, or, 15, or 45, 150. Greather periods are very useful at strong support - resistance areas. IF ONE OF OUR FREE INDICATOR IS NICE TO YOU, FEEL FREE TO BUY AT LEAST OUR CHIEPST PRODUCT TO DONATE US. "Lots of small peace can be a mountain" ( nathan rothschild, john len
FREE

I think you all know Donchian Channels. so I am not going to write about it.
With this indicator I tried to create Donchian Trend Ribbon by using Donchian Channels.
How it works ?
- it calculates main trend direction by using the length that is user-defined. so you can change it as you wish
- then it calculates trend direction for each 9 lower lengths. if you set the length = 20 then the lengths are 19, 18,...11
- and it checks if the trend directions that came from lower lengths i
FREE

MT5 Alert Indicator Please add Ema moving averages 60/100/200 & Rsi period 10 levels 30/70 to your chart. This indicator alert on a trend reversal strategy were - ema 60 > 100&200 - ema 100 < 200 And the Rsi is below 30 FOR BUY SIGNAL
Use this strategy in confluence with a larger timeframe trend in the same direction. This strategy identifies great entry opportunities to enter an early trend.
FREE

Koala Price Action Scanner - Monitor power of price action in all pairs easier than ever , all in one panel
Join Koala Trading Solution Channel in mql5 community to find out the latest news about all koala products, join link is below : https://www.mql5.com/en/channels/koalatradingsolution Introduction: Discover the new Koala Price Action Scanner – a versatile, multi-currency, and multi-time frame tool designed to detect essential price action patterns and present them in an intuitive scanner
FREE

AC Pivot Panel
AC Pivot Panel is a pivot point indicator including favorite selection panel accessible in the chart. For pivot traders, It is well convenient to easily and quickly can adjust their pivots setting in the chart. To reaching this goal, a panel has been considered to user can easily switch to each pivot levels by different method and time period. In the current version: All pivots including supports and resistance can be selected to display or disappear in the chart just by
FREE
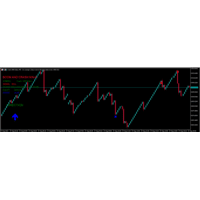
The indicator has three signals. The two arrow signals and when you get the message expect the spike. You only enter the market when all the conditions are met. The big arrow indicates the overall market direction while the small arrows indicates the support and resistance. Message "Expect spike" indicates that the market is about to spike so if you are trading against it you should exit that market.
FREE

MT5 Hammer Pattern Detector: Your guide to more profitable operations
Tired of searching for the best trading opportunities? Our innovative indicator gives you a competitive advantage by automatically identifying hammer patterns on your charts. Known for its high probability of success, the hammer pattern has been a fundamental tool in the arsenal of experienced traders for decades. Our indicator, designed to accurately detect this key pattern, will allow you to:
Identify trend reversals ea
FREE

Demand and supply zones Support and Resistance areas Show broken zones Show tested and untested zones Show weak zones Fractal factors Notifications when price reaches point of Interest with Push notifications and pop ups Customizable History Clickable Works on all Timeframes Works on all pairs.
Free for a while till further notice and changes. The demand and supply bot coming soon
FREE

Because style matters I know how annoying it is to click properties every time to change the candle’s color, the background to light or dark, and put or remove the grid. Here is the solution with one click: Three customizable buttons to choose the candle style that traders want. One button to switch between Day and Night mode. One button to show or hide the Grid on the charts. *****On the settings, you can choose where the buttons should be displayed on the screen***** Also, consider checking m
FREE

The indicator analyzes the chart and identifies Doji candlesticks. Shows their appearance and signals the appearance of such a candle (if allowed in the parameters). Also, this indicator shows the strength of the reversal in the form of bars of different colors (the more green, the more likely the rise, the more red - the fall in price). The direction of the signal depends on the direction of the previous candles, as the Doji signals a reversal or correction. In the indicator settings, you can
FREE

CYCLE WAVE OSCILLATOR indicator is an indicator based on cyclical price fluctuations. This indicator can help you determine overbought and oversold levels, and help you predict price trends within the cycle. MT4 Version here! You can combine it with our indicators below to make your trading decisions more accurate: Supply Demand Ribbon MT5 Basic
Feature: - Three Trend Types: + Zero + Basic + Advanced
FREE

Introduction to Fractal Moving Average Fractal Moving Average indicator was designed as part of Fractal Pattern Scanner. Inside Fractal Pattern Scanner, Fractal Moving Average Indicator was implemented as multiple of chart objects. With over thousands of chart object, we find that it was not the best and efficient ways to operate the indicator. It was computationally too heavy for the indicator. Hence, we decide to implement the indicator version of Fractal Moving Average indicator to benefit ou
FREE

Like most things that work in trading, it's really simple. However, it's one of the most powerful tools I have that makes entries of many systems much more precise.
In its essence, it measures the recent volatility against the medium-term average. How does it work? Markets tend to be prone to strong trending movements when relative volatility is low and tend to be mean-reverting when relative volatility is high.
It can be used with both mean-reversion systems (like the Golden Pickaxe) an
FREE
Engulfing Pattern is a free indicator available for MT4/MT5 platforms, its work is to provide "alerts" when a "Bullish" or "Bearish engulfing pattern forms on the timeframe. This indicator comes with alerts options mentioned in the parameter section below. Join our MQL5 group , where we share important news and updates. You are also welcome to join our private channel as well, contact me for the private link. Engulfing Pattern Indicator MT4 Other Products Try our Martini EA with 2 years of liv
FREE
The MetaTrader Market is the best place to sell trading robots and technical indicators.
You only need to develop an application for the MetaTrader platform with an attractive design and a good description. We will explain you how to publish your product on the Market to offer it to millions of MetaTrader users.
You are missing trading opportunities:
- Free trading apps
- Over 8,000 signals for copying
- Economic news for exploring financial markets
Registration
Log in
If you do not have an account, please register
Allow the use of cookies to log in to the MQL5.com website.
Please enable the necessary setting in your browser, otherwise you will not be able to log in.