Watch the Market tutorial videos on YouTube
How to buy а trading robot or an indicator
Run your EA on
virtual hosting
virtual hosting
Test аn indicator/trading robot before buying
Want to earn in the Market?
How to present a product for a sell-through
Free Expert Advisors and Indicators for MetaTrader 5 - 19

This indicator can help you clearly identify trend changes in both bullish and bearish markets. The indicator compares the closing price of the last candle with the closing price of the candle "X" periods ago (input parameter). In an uptrend, an initial number '1' is plotted if a candle closes higher than the closing of a candle "X" periods ago. In a downtrend, an initial number '1' is plotted if a candle closes below the closing of a candle "X" periods ago. Subsequent numbers are plotted when e
FREE

Time and Price Fractal Studies is an indicator that will help you identify certain patterns that tend to repeat themseleves at certail times of the day or at certain prices. It is used to study Fractal Highs ad Lows in relation to time and price. You will get to answer certail questions like: At what time of day does this market usually turn around. At what price does the market turn. Is it at round numbers etc.
FREE

Esse indicador é a combinação do RSI (IFR) com Média Móvel Simples aplicada o RSI em um único indicador para facilitar a criação de alguma estratégia. Fiz esse indicador para que um único indicador contenha os buffer necessários para implementar alguma EA.
Descrição dos Buffers para o EA,
Buffer 0 -> Valor do RSI Buffer 1 -> Valor da média móvel aplicada ao RSI
FREE

The "YK-LOT-SIZE" is a custom indicator for MetaTrader 5 (MT5) that displays the total lot sizes and profits for both buy and sell positions on the current chart. Key features of the indicator: It calculates the total lot sizes for all open buy and sell positions of the current symbol. It calculates the total profits (including commissions and swaps) for all open buy and sell positions. The indicator displays the information on the chart using two lines of text: "BUY Lots: [total buy lots] | BUY
FREE

This indicator displays fractal symbols and bars Use this indicator to show different symbols for bearish and bullish fractals: Choose from 144 symbols (refer to table below) Colors, size and offset of fractals can be modified Fractal price bar or candle color can be changed Hide fractals and show fractal price bar only Frequency in fractal calculation can be changed
How to use 1. Select which symbols to use for bearish and bullish fractals; 2. Select which colors to use for bearish and bulli
FREE

https://www.youtube.com/watch?v=0T8Mge39Xsk&t=9s
Youtube
These EAs trade macd divergence only if there is a parabolic sar change at the same time. Sell bearish macd divergence & parabolic sar crosses above price Macd settings Threshhold is how far above / below zero divergence must occur. Timeframe used Parabolic sar settings
Only one trade in that direction can be opened at once. Trades on open bar Alerts , mt5 and mobile Stop loss and target points Stop loss is set to a % percentage of
FREE

The Trading Sessions indicator is a simple tool that helps to highlight a specific trading session. For example, it can be used to differentiate the European, American or Asian sessions.
Main features The indicator shows a user-defined trading session. Alert notifications for the start and end of the session. Custom session time. Works on every timeframe (M1, M5, M15, M30, H1, H4, D1, W1, MN). Customizable parameters (Colors, alerts...). It can be used for creating EA. Available for MT4 a
FREE

Estratégia de negociação MACD O cálculo do MACD é executado uma vez a cada tick, e são considerados para fim de cálculo os três últimos resultados, para analisar o cruzamento da linha de zero, ou seja quando o último resultado for maior que 0 e o antepenúltimo não então há um cruzamento para cima e analogamente para baixo, quando um cruzamento é constatado o estado de uma variável de controle é alterado de "false" para "true", permitindo o abertura de uma posição caso a média de sinal também cru
FREE
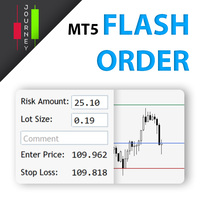
Trading has never been easier! Let's check this out! MT4 version: https://www.mql5.com/en/market/product/72118 The story: How I boost up my trading speed without any "Invalid SL or TP" error
NOW ALL YOU NEED TO DO IS Drag the lines Press Open Order button Enjoy! With this tool, you will no longer have to enter prices manually, which can cause many mistakes and you could miss the trade! From the board, we have: Risk Amount : the risk you want to apply for your trade Risk Unit : USD : If sel
FREE

Seeing and interpreting a sequence of Candlesticks is easy to spot when you are a human... Higher Highs, Higher Lows, are the panorama of a Buying trend, at least in a short period of time... Seeing a current candlestick higher high and a lower candlestick low, as a human, you can immediately spot a "divergence", an "alert", a "starting range", but in the end and based on other analysis a human trader can understand and behave accordingly to this kind of candlestick data... But what about EAs (r
FREE

Experience the exhilarating world of trading with Boom or Bust, the groundbreaking MT5 trading game that takes your skills to the next level. Get ready to embark on a thrilling journey of virtual trading, where you can test your strategies and immerse yourself in the dynamic world of financial markets—all without risking real money. Experience the exhilarating world of trading with Boom or Bust, the groundbreaking MT5 trading game that takes your skills to the next level. Get ready to embark on
FREE

AliSession Highlight is an indicator that highlights a specific period of time according to your preferences. It can help you gain a clear vision of price movements into a specific session, the range of a session, and also to easily identify the high and low of the session. You can use it on any currency pairs, indices, and any timeframes. Settings: Start Hour: Set the hour to initiate the session highlight. Start Min: Set the minute for the start of the session highlight. End Hour: Specify the
FREE

This indicator provides common shapes as drawing object options. The shapes are rotatable, resizable, draggable, and will keep their proportions (according to their handle trendline) across different chart scales. Multiple drawings are supported.
Shapes: Square Rhombus
Triangle (quadrilateral & isosceles) Circle (grid, overlapped grid, flexi grid, rotatable grid, concentric circles) Features: rays (all object edges will be rays) show/hide each individual drawing type, or all delete last drawn
FREE

Camarilla Swing Trade Indicator is an Indicator. Support and resistance points are calculated from the High Low Close of the previous TF Week's price.
What are Camarilla Pivot Points?
1.Camarilla Pivot Points is a modified version of the classic Pivot Point. 2.Camarilla Pivot Points was launched in 1989 by Nick Scott, a successful bond trader. 3.The basic idea behind Camarilla Pivot Points is that price tends to revert to its mean until it doesn't. 4.Camarilla Pivot Points is a mathematical
FREE

This EA uses the RVI Crossovers. A crossover above the signal line is a bullish indicator, while a crossover below the signal line is a bearish indicator.
The Relative Vigor Index (RVI) is a momentum indicator used in technical analysis. It measures the strength of a trend by comparing a security's closing price to its trading range while smoothing the results using a simple moving average (SMA).
The Relative Vigor Index is considered a leading indicator, meaning it changes before the trend
FREE

TG MTF MA MT5 is designed to display a multi-timeframe moving average (MA) on any chart timeframe while allowing users to specify and view the MA values from a particular timeframe across all timeframes. This functionality enables users to focus on the moving average of a specific timeframe without switching charts. By isolating the moving average values of a specific timeframe across all timeframes, users can gain insights into the trend dynamics and potential trading opportunities without sw
FREE

Several assets in several markets have the behavior of using specific numbers as Force Numbers, where support, resistance and price thrust is created. Let this indicator draw those levels of support and resistance for you. You can also stack it to show different level of Prices! This technique is being used by Tape Readers and Order Flow traders all over the world for a long time. Give it a try. Challenge yourself to study new ways of Price Action!
SETTINGS
What Price reference to use in th
FREE

Algo Edge EA DE40 / Tec100 Tipp: Change the Robot Worktime to 10:01-10:10. Just a few Minutes of Robo Worktime have high WIN Results because floating Term. Self learning EA just set the EA on the Chart and Start no Settings optimization.
DE40 , US30, Tec100, US500 and much more.
Multifunctional Expert Advisor can trade with every Indize without any Changes. Tipp: Swipe manuell after the Robot open a Trade the Stop Loss immediately to the opening Level. Close the Profit and shut down the Rob
FREE

Sentimento de Mercado é um indicador que usa os dados do nosso principal indicador: Market Strength Radar.: https://www.mql5.com/pt/market/product/114568?source=Site +Profile+Seller Ele imprime um gráfico de linhas que deve ser comparado com o gráfico de preço para entendermos o sentimento do mercado. As divergencias são pontos importantes de inflexão. As convergências mostram força da tendência atual.
FREE

Introducing the Accelerator Divergence Indicator, a powerful tool designed to enhance your Forex trading experience. This innovative indicator is specifically crafted to identify market divergence, providing traders with valuable insights for more informed decision-making. The Accelerator Divergence Indicator utilizes advanced algorithms to detect divergence in the market, visually guiding traders with precision-drawn lines that highlight key points of interest. Divergence occurs when the price
FREE

El indicador técnico Trend Magic es una herramienta de análisis de tendencias que combina el Índice de Canal de Mercancía (CCI) y el Rango Verdadero Medio (ATR) para identificar la dirección de la tendencia del mercado. Aquí tienes un resumen de sus pros y contras, así como las mejores condiciones del mercado para su uso:
Pros: - Identificación clara de la tendencia: Cambia de color para indicar tendencias alcistas (azul) y bajistas (rojo), lo que facilita la visualización de la dirección del
FREE

This indicator displays Point & Figure charts (PnF charts) in the indicator window. PnF charts show only price movements that are bigger than the specified box size. It helps to eliminate noise and allows focusing on main trends. Time is not a factor here. Only price movements are taken into account. That is why PnF chart is not synchronized with the main chart it is attached to. More about PnF charts: http://stockcharts.com/school/doku.php?id=chart_school:chart_analysis:pnf_charts Indicator wor
FREE

Volume Projection Indicator The Volume Projection Indicator is a specialized tool designed for traders who focus on the relationship between volume and price action. This intuitive indicator projects the expected volume for the ongoing candle, aiding in decision-making during live market conditions. The indicator presents volume data in a histogram format directly on the chart for quick analysis. Features: Bullish Volume Representation : Each green bar in the histogram signifies the volume for a
FREE

Kindly rate and comment about the product for upgradation & Support
The 5 EMA is plotted in green color ( Lime ).
The 14 EMA is plotted in red color ( Red ).
The 20 EMA is plotted in blue color ( Blue ).
The 200 EMA is plotted in yellow color ( Yellow ).
The Quarter EMA that provided calculates and plots four Exponential Moving Averages (EMAs) on the chart using different periods: 5, 14, 20, and 200. Each EMA is represented by a different color on the chart. Here's a description of each
FREE

Copy trades with ease using the MetaTrader5 trade copier - the quickest and easiest way to copy transactions between different MetaTrader 5 accounts! This innovative tool allows you to locally copy trades in any direction and quantity, giving you full control over your investments. Designed to work on both Windows PC and Windows VPS, this program is versatile and adaptable to your trading preferences. Whether you prefer to work from your desktop or a virtual private server, the MetaTrader5 trade
FREE
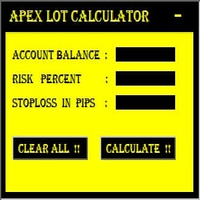
MT5 It Calculates Lot size for Manual Money Management.
If you want any custom feature or want to remove something from this product for your personal use. Please send me a personal message, I'll be happy to do so for you.
Inputs : Account Balance Risk Percent StopLoss in Pips
How to Use it : Put it on the Chart of Currency Pair which wanted to be Calculated Fill up All three Input fields with Desired Details After filling input
FREE

Удобный трендовый индикатор. Не меняет своих значений. Имеет огромные возможности для настройки. Не требователен к ресурсам компьютера. Создавался для работы в системе BearsHunter. Эксперт МТ5 с использованием данного индикатора: https://www.mql5.com/ru/market/product/30381 Эксперт МТ4 с использованием данного индикатора: https://www.mql5.com/ru/market/product/30383
Параметры:
m1_MA_Mode_1 - метод усреднения(0-9). m1_MA_Mode_2 - метод усреднения(0-9). m1_MA_Mode_3 - метод усреднения(0-9). m1
FREE

MT4/5通用交易库( 一份代码通用4和5 ) #import "K Trade Lib5.ex5" //简单开单 long OrderOpen( int type, double volume, int magic, string symbol= "" , string comment= "" , double opprice= 0 , double sl= 0 , double tp= 0 , int expiration= 0 , bool slsetmode= false , bool tpsetmode= false ); //复杂开单 void SetMagic( int magic, int magic_plus= 0 ); void SetLotsAddMode(int mode=0,double lotsadd=0); long OrderOpenAdvance( int mode, int type, double volume, int step, int magic, string symbol= "" , string comm
FREE

Momentum Reversal is a powerful tool for detecting possible reversal points and the beginning of correction, based on the analysis of the intensity of price movements and bar formations.
_________________________________
How to use the indicator signals:
The indicator generates a signal after a new price bar appears. It is recommended to use the generated signal after the price breaks through the critical point in the specified direction. The indicator does not redraw its signals.
_____
FREE
This utility allows creating any amount of grid orders just by clicking with the mouse.
Instructions:
Trading mode
Deleting mode
Press ctrl and click with mouse to start drawing a grid While drawing, press shift to cancel Release buttons to send orders
Press shift and click with mouse to draw a removal line
Release buttons to confirm removal: EA deletes every pending order that the line touches
Inputs: - 3 options to calculate the grid sizing: Fixed points distance between gr
FREE

Qstick is a way to objectively quantify candlestick analysis and improve the interpretation of candlestick patterns. Qstick was developed by Tushar Chande and published in his book " The New Technical Trader - Boost Your Profit by Plugging Into the Latest Indicators (1994) ". Qstick is built based on a moving average of the difference between the Open and Close prices. The basis of the idea is that the Opening and Closing prices are the heart of candlestick analysis. We strongly recommend the re
FREE

A big thank you for your interest in our product. MustForex Bollinger Bands V1 Premium Expert advisor
Its follows a determined Swing strategy. It trades by following and analysing Bollinger Bands indicator to determine entry and exit point. Profits can be locked by the adjustable trailing stop/Break Even inputs. Every trade protected with dynamic auto stop loss and dynamic auto take profit to protect your account. Since the strategy works with quick swing trade profits it is highly s
FREE

Sync Cursor MT5 | MT4 Sync Cursor MT4 https://www.mql5.com/en/market/product/118067 MT5 Tool will It make the Horizontal Line + Vertical Line in the Screen That it is always present on the screen and that it moves along with the candle (with the price). I am sure that something so simple will be a Treasure in the hands of many people.
Some of my personal trades are posted voluntary and free of charge in this Public channel https://t.me/FXScalpingPro
Contact: https://t.me/TuanNguyenTrader
FREE

It's a triangular arbitrage system (three pairs correlation system) to use 3 currencies to make 3 pairs to open hedge orders on those.
The expert starts opening six orders for each ring (3 plus and 3 minus) and waits to move prices in one direction to make a grid of orders.
The expert can use a maximum of 8 currencies to make 28 pairs and make 56 rings.
It is important the order of currencies is from the strongest to the weakest.
Strongest... EUR/GBP/AUD/NZD/USD/CAD/CHF/JPY ...weakest.
FREE

Main: Not martingale, not a grid; Working on all symbols;
Signals: There is a good rational algorithm. Work of two indicators: Envelopes and Moving Average (you can set a separate Timeframe for each indicator)
Stop Loss/Take Profit: There is a good money management system (there are several type for trailing stop loss); There is virtual levels of Stop Loss / Take Profit; There is smart lot (percent by risk) or fix lot
Important: EA can work on closed candles, and on current candles; Quick
FREE

パラボリックのデータをもとにトレンドの方向性を1分足から月足まで表示します。 1分足から 月足 まで表示されているので今どの方向に価格が動いているのかがすぐに分かります。
更新はティク毎ではなくディフォルトでは1秒毎、もちろん変更も可能なのでチャートの表示が遅くなるようなことはありません。
機能:
どの通貨でも表示可能になります。
アイコンの色を指定することが可能になります。
表示位置(X軸、Y軸)が変更可能 になります。
表示位置 (左上 、 右上 、 左下 、 右下) が 指定 が可能 になります。
フォント を指定することが可能になります。
フォントサイズ が 変更可能 になります。
アイコンのサイズ が 変更可能 になります。
週足、 月足 の非表示 が 可能 になります。
FREE

Many friends asked me for a simple, non-obtrusive, resource-friendly clock to track the time during their trades. It seems pretty obvious, but it is a must-have for those trading the market manually, waiting for the Market News, or just to visually know what time it is... Trading is an absorbing endeavor! So, here it is... Totally configurable, including Font Type, Font Size and Chart Location: Upper Left/Center/Right OR Lower Left/Center/Right, with a little twist of adjusting the Offset, just
FREE
The Expert Advisor recommended for trade on EUS/GBP M15. It is based on free indicator "UpdatedRSI", and Neuro networks AI. The robot calculates the market entry/exit points based on signals from indicator "UpdatedRSI". The trading volume for opening a position depends on results of previous trades. It is possible to limit the amount of risk (the AutoMM parameter). It uses an efficient trailing, which automatically adjusts the take profit and stop loss parameters to minimize losses. It also has
FREE

This panel displays the price percentage change
Shows the percentage change in price from the last open: Daily, Weekly and Monthly timeframes. Numbers are easier to use than histogram currency meters. Line up the three timeframes strengths/weaknesses for strong trends. Compare currencies strongest against weakest. USD is the world's reserve currency to compare against.
How to use 1. Match the strongest currency with weakest currency; or 2. Match the strongest or weakest currency against US
FREE

Что такое Awesome Oscillator? Создателем данного индикатора является Билл Вильямс. Этот трейдер разработал собственную торговую систему. Её основой служит постулат: «Рынок движется хаотично. Какие-либо закономерности этого движения вывести довольно сложно, так как многое зависит от психологических факторов.» Поэтому Вильямс разработал собственные инструменты для анализа рынка.
Одним из таких инструментов и является индикатор АО. Это осциллятор, который дает возможность выявить силу текущего
FREE

This is a usefull utility for monitoring spread and also for recording informations to a file. (Files will be placed into "Common\Files\Spread Monitor"). There is the possibility to let the indicator calculate high/low into the past thanks to downloading ticks. (It's a slow and approsimate thing! The best way to use it is to attach to a chart and let it recording spread in real time). There is also a buffer with the average of spread in latest X periods.
Easy and effective.
FREE

A very useful Price Action point is the previous day Closing VWAP. We call it Big Players Last Fight . This indicator will draw a line showing on your chart what was the last VWAP price of the previous trading session. Simple and effective. As an additional bonus, this indicator saves the VWAP value on the Public Terminal Variables, so you EA could read easily its value! Just for the "Prefix + Symbol name" on the variables list and you will see!
SETTINGS How many past days back do you want to
FREE

Genaral: Not martingale, not a grid; Use on EURUSD Use on M5 EA was opimized only on 2020 year
Signals: There is a good rational algorithm. Work of 3 indicators: WRP, DeMarker, CCI (from 3 timeframes) (you can set a separate Timeframe for each indicator)
Stop Loss/Take Profit: There is a good money management system (there are several type for trailing stop loss); There is virtual levels of Stop Loss / Take Profit; There is smart lot (percent by risk) or fix lot
Important: EA can work
FREE

Highly configurable Awesome Oscillator (AO) indicator. Features: Highly customizable alert functions (at levels, crosses, direction changes via email, push, sound, popup) Multi timeframe ability Color customization (at levels, crosses, direction changes) Linear interpolation and histogram mode options Works on strategy tester in multi timeframe mode (at weekend without ticks also) Adjustable Levels Parameters:
AO Timeframe: You can set the current or a higher timeframes for AO. AO Bar Shift:
FREE

这是一个组合指标分析趋势、支撑阻力、买卖点。运用了均线MA、布林带、KDJ、CCI、RSI。 主图上下线是布林带上下线,采用的是20周期和2.3标准差可以用来支撑阻力。 中间的是分析趋势的均线,趋势分析是用均线多周期: 为涨趋势,反之为下跌趋势。在同一种颜色,基本说明趋势没有发生变化。 子图是由 KDJ、CCI、RSI三个指标组成,大于70超买,小于30超卖, 智能提示是运用了算法,主要计算布林带, KDJ、CCI、RSI指标
有三个或四个指标超出市场常态就会发出提示行情可能反转。 子图指标运用了很多数据,刚刚开始加载会有点慢,耐心等待就可以 这个指标是主图指标,还要再下我发布的RCD分析,这样就刚刚好组成一套分析 电脑分辨率的文本大小请设置100%,不然字体会不一样
FREE

This indicator shows ratios between extremes on the chart. You can specify your own ratios (e.g. Fibonacci).
Parameters Most important Density - how much in details to search ratios in extremes. Bigger number means less details, smaller number means more details. Base unit is 1 bar on the chart. History - how far to go in history while searching. When you set -1, the indicator processes all bars from history. Base unit is 1 bar on the chart. Range - how far search ratios from given extreme. Ba
FREE

Unlock the power of trend analysis with the Candle Trend Bars Indicator – your go-to tool for identifying and understanding market trends like never before. This innovative indicator transforms traditional candlestick charts into a dynamic and visually intuitive representation of market trends. Key Features: Trend Clarity: Gain a clear and concise view of market trends with color-coded bars that instantly convey the direction of price movements. User-Friendly Design: The indicator is designed wi
FREE

At first, I got my teeth into Dragon Ultra Expert Advisor. Take your time to test demo. You should be always perfectly familiar with your Expert Advisor before a live trading. Based on the statistics, you are more likely to succeed if you learn from experience to use this. Dragon Lite is a free version for you to understand how the bot works. Parameter Trading Mode: Change to UNLIMITED. You should use the Dragon Training proficiently before using the Dragon Ultra .
The Forex T
FREE

El indicador técnico propuesto es un sistema de medias móviles de múltiples marcos temporales diseñado para ayudar a los operadores del mercado financiero a seguir de cerca los movimientos tendenciales. Al combinar medias móviles de diferentes períodos, este indicador ofrece una visión más completa de la dirección de la tendencia, lo que permite a los traders identificar oportunidades de trading con mayor precisión. Al utilizar este indicador, los operadores pueden maximizar sus ganancias al tom
FREE

An analogue of the Stochastic oscillator based on algorithms of singular spectrum analysis (SSA) SSA is an effective method to handle non-stationary time series with unknown internal structure. It is used for determining the main components (trend, seasonal and wave fluctuations), smoothing and noise reduction. The method allows finding previously unknown series periods and make forecasts on the basis of the detected periodic patterns. Indicator signals are identical to signals of the original i
FREE

Autumn-Harvest EA
Features Multiple strategies for entry and exit Open buy and sell positions and set applicable amounts for each Smart stop-loss and trailing stops levels EA can be set to only maintain own deals or any open deal eMail and telegram alerts on buy/sell signals ( * Configure the email tab under options for trade opportunity email alerts to work ) Monitoring using heartbeat checks
About This EA is capable of opening trades using various strategies. Once the trades are open it a
FREE

Trend Tracking Indicator with Input Signal Average Filter
This indicator acts as a trend tracker and filter, using moving averages as entry signals. Moving averages are key to determining different trend horizons: - The standard 200-period primary average indicates the long-term trend. - The 50-period secondary average indicates the medium-term trend. - The 20-period tertiary average indicates the shortest trend. - The nine-period average serves as an entry trigger for immediate actions.
Thi
FREE

Candle cross MA is an indicator that works "silently", that is, drawing only a moving average on the chart.
It alerts you when the last candle cross with a moving average that you set. Alert is given only when the candle closes.
The moving average settings are fully customizable.
The indicator sends popup, and push notifications. You can also deactivate alerts when the chart is inactive. Are you the trend type? Do not miss another opportunity!
FREE

Tillson's T3 moving average was introduced to the world of technical analysis in the article ''A Better Moving Average'', published in the American magazine Technical Analysis of Stock Commodities. Developed by Tim Tillson, analysts and traders of futures markets soon became fascinated with this technique that smoothes the price series while decreasing the lag (lag) typical of trend-following systems.
FREE

This EA offers features: Stoploss (Risk Management), Take Profit (Close Order, Strategy), Traling stop (after candles or below range), closing the order (strategy), Candle count for range and much more. 1: Magic number 2: Fixed Lot 3: Slippage 4: Loss Order of Day. Trading desabled 5: Loss Position true/false 6: Loss Position Close (%) 7: Profit of Day. Trading desabled 8: Profit Close true/false 9: Profit Close (%) 10: Tralling true/false 11: Total Orders! (Pyramide) 12: Rectangle Number of ca
FREE
This indicator is designed to provide all useful information about symbol, account, positions and profit. It is developed for improving trader's money management.
Parameters Calc can be divided to separate blocks. Each block is possible to hide, set its own color and other properties. Block symbol: This block displays information about actual SPREAD, POINT VALUE (in deposit currency for 1 lot), SWAP LONG and SHORT. Show symbol info - display/hide this block Color of symbol info - color of this
FREE

Overview: The "ATRBBOpener" is a trading robot designed to operate on the GBP/USD currency pair. Tailored for an H1 (one-hour) trading timeframe, this robot is ideal for traders seeking a balanced approach between short-term and medium-term trading strategies.
Technical Indicators Used: Average True Range (ATR): The robot incorporates ATR to measure market volatility and determine stop loss and take profit levels. This indicator helps identify periods of high and low volatility. Bollinger Band
FREE

VolumeFlow is a Volume Accumulation / Distribution tracking indicator. It works in a similar way to OBV, but it is much more refined and includes the options to use: Classical Approach = OBV; Useful Volume Approach; Gail Mercer's approach; Input Parameters: Input Parameters: Approach Type: Explained above; Volume Type: Real or Ticks; Recommendations: Remember: The TOPs or BOTTONS left by the indicator are good Trade Location points. This is because the players who were "stuck" in these regions w
FREE

I present the well-known Fractal indicator.
Levels have been added to this indicator.
At the extreme points, you can see the continuation of the price line, which changes when the values of the Fractal indicator change.
The indicator is easy to use. The basic Fractal settings have been saved.
FractalLevels Parameters:
LeftBars - the number of bars on the left
RightBars - the number of bars on the right
FREE

The DJ_M5_810504785_L_OD_CF_1522_SQX is an algorithmic trading strategy for MetaTrader, tested on DJ using the M5 timeframe from December 7, 2017, to June 2, 2023. There is no need to set up parameters, all settings are already optimized and fine-tuned.
Recommended broker RoboForex because of EET timezone.
You can find the strategy source code for StrategyQuant at the link: http://quantmonitor.net/listing/dow-jones-bollinger-master/
Key details are:
MagicNumber: 810504785 Main Chart
FREE

ATR MTF indicator means ATR in ALL TIME FRAMES
By running this indicator, you can see the current ATR number of all time frames on your chart, and you do not need to change the time frame .
The main ATR indicator of MetaTrader is not required anymore because by ATR MTF all your requirements to the average of the true range are solved and all ATR numbers will be shown in the optional position of the screen .
This indicator is published for free and it is forbidden to sell it to others.
I
FREE

TimeBar TimeBar is a simple information indicator that shows the remaining time until the bar closes, as well as the time elapsed since the bar opened and the current time. For ease of perception, two types of display modes have been added: in the form of a comment in the upper left corner of the graph, or in the form of a graphic object.
Advantages Font selection Font size. You can set any one. When commenting it is too small You can move objects. Any time can be selected by double clicking
FREE

Candle size oscillator is an easy to use tool to figure out candle size from highest to lowest price of each candle. It's a powerful tool for price action analysts specifically for those who works intraday charts and also a perfect tool for short term swing traders. Kindly note that you can also edit the Bullish and Bearish candles with different colors.
#Tags: Candle size, oscillator, price action, price range, high to low, candle ticks _________________________________________________________
FREE

Maximum Minimum Candle indicator is a basic indicator (but useful) that shows the highest and lowest candle in a period of time .
The indicator shows the maximum candle and the minimum candle for a defined period of time. You can choose the number of candles that make up the period The indicator will show with color points the maximum and minimum values. A message tells you when the price reaches the maximum or minimum.
Parameters number_of_candles: It is the number of candles that will b
FREE

The Stochastic Oscillator is one of the main indicators used in the analysis of financial assets. It is one of the highlights in the study of price movements and can be an important indicator of changing trends in the capital market. Stochastic is an oscillator used to identify when an asset is overbought or oversold. It consists of two lines: %K, which is calculated from the highs and lows of a period, and %D, which is a moving average of %K. Our version contains color filling, which facilitate
FREE

This software uses classical rules to the entry and exiting of the trades when trading using the ichimoku style. The EA trades in the current timeframe on the charts. According to testing results yielded more than $1k using the 1hr chart in the past year. The EA should not be expected to perform well when the price is ranging and too volatile. The best results should be achieved when the EA is turned on in the trending market only and under a solid money management plan. The results shown on the
FREE
Aydmaxx Trade Tracker Description: Aydmaxx Trade Tracker is a powerful and user-friendly tool for traders, allowing you to monitor the current profit or loss for each trade in real-time. The indicator displays the information directly on the screen, helping traders quickly assess the results of their trading operations. Key Features: Displays the current profit or loss for all open positions in real-time. Customizable corner of the screen for displaying information (default is the bottom right c
FREE

Full Automated Trading panel . it works on any trading instruments: Forex, Stocks, Futures, Indices, CFD, Bonds, Cryptocurrencies; interface minimization function; flexibility of use;
Join my channel and check video of it ===> https://t.me/Ash_TheTrader/4986
Features :
Auto SL and TP Auto Close partial Auto Trailing Session Time Alert Time of trading Alert Profit and Percentage and etc.
FREE

The Hyper Force indicator, originally created in 1984 by David Weis, indicates in wave form the strength of a symbol's trend.
The bigger the wave, the stronger the trend.
Small waves mean weak trend or market without trend.
In a wave, the greater the difference between one bar and another, the stronger the trend.
When the distance between one bar and another begins to decrease, it means that the wave has started to lose its tendency.
So catching the wave with a strong force and going
FREE
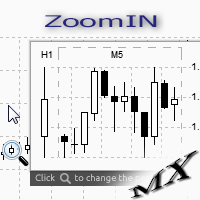
The ZoomIN MT5 indicator is designed for quickly viewing the selected bar on the smaller timeframes in a pop-up window. Once launched, the indicator works in the background, does not take up space on the chart and does not consume system resources. When the indicator is activated by the Shift + i combination (can be changed in the settings), a pop-up window with a chart of a smaller timeframe is created. The displayed timeframe can be changed by a left-click on the magnifying glass icon. To hide
FREE
Learn how to purchase a trading robot from the MetaTrader Market, the store of application for the MetaTrader platform.
The MQL5.community Payment System supports transactions via PayPal, bank cards and popular payment systems. We strongly recommend that you test the trading robot before buying, for a better customer experience.
You are missing trading opportunities:
- Free trading apps
- Over 8,000 signals for copying
- Economic news for exploring financial markets
Registration
Log in
If you do not have an account, please register
Allow the use of cookies to log in to the MQL5.com website.
Please enable the necessary setting in your browser, otherwise you will not be able to log in.