Watch the Market tutorial videos on YouTube
How to buy а trading robot or an indicator
Run your EA on
virtual hosting
virtual hosting
Test аn indicator/trading robot before buying
Want to earn in the Market?
How to present a product for a sell-through
Paid Expert Advisors and Indicators for MetaTrader 4 - 227

It is the same of Advanced Arrow indicator but shows the signal of 8 currencies pairs at the same time on 5 Timeframes without any TPs line or SL.
Features You will know when exactly you should enter the market. This indicator does not repaint it's signals.
Signal Types and Timeframes Used You can use this indicator on any timeframes but i recommend you to use it on H1, H4 frames. The indicator gives you four signals (Ready to Buy "RBuy", Ready to Sell "RSell", Buy, Sell). When RBuy appear y

The strategy is based on OsMA and Moving Average indicators. The Expert Advisor buys when the fast MA exceeds the slow one and OsMA histogram bars are located in the following order: the first bar exceeds the second one, while the second bar is lower than the third one. The opposite is true for selling. The product is designed for 4 and 5-digit quotes and should be launched on a VPS server. Expert Advisor Installation It is recommended to launch the EA on several adjacent currency pairs with the

The strategy is based on the MACD and Moving Average indicators. It buys when the fast MA is above the slow MA and the MACD histogram is above the signal line. It sells when the fast MA is below the slow MA and the MACD histogram is below the signal line. Designed for 4 and 5-digit quotes, use it on a VPS hosting. Launching the EA It is recommended to launch the EA on several adjacent currency pairs with the same magical numbers. For example: GBP USD , EUR USD , AUD USD , NZD USD ; or USD CAD, U

Recommendations, warnings, notes - https://www.mql5.com/ru/blogs/post/759146 Советник способен успешно торговать на разных валютных парах. По умолчанию робот настроен на следующие пары - AUDCAD , GBPCAD , AUDNZD , USDCAD , GBPUSD , AUDCHF , GBPAUD , NZDCAD , CADJPY , NZDUSD , AUDUSD . Однако, это далеко не весь список валютных пар, на которые робот может быть настроен и они будут добавляться в новых версиях советника. Параметры PeriodEA - период работы советника; isNewBar - флаг разрешения на

Scalper GBP is a scalper EA intended for trading EURGBP, GBPUSD and GBPCAD. The fundamental principles of the Scalper GBP are similar to the principles of the Yogi EA . The introduction of new functions, the revision of market entry logic and other changes allowed to adapt to trading new pairs. The Expert Advisor does not require optimization and will not become obsolete over time. The Expert Advisor does not use hedging, martingale, grid strategies, arbitrage, etc. Most of the settings are alre
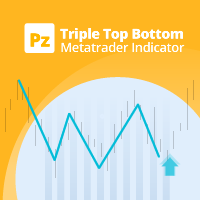
Leverage triple top and bottom patterns for better market timing
The triple top and bottom pattern is a type of chart pattern used in to predict the reversal of trend. The pattern occurs when the price creates three peaks at nearly the same price level. The bounce off the resistance near the third peak is a clear indication that buying interest is becoming exhausted, which indicates that a reversal is about to occur. [ Installation Guide | Update Guide | Troubleshooting | FAQ | All Products ]

Professional OB/OS Oscillator Is the digital momentum indicator , based on our ob/os formula and algorithm of digital output signal .
It shows you when price goes on OverBought/OverSold position and also OverBought/OverSold of Trend .
In the middle is an adjustable " Stop_level ". Above and below this area you should not trade .
Precise; above Stop_level - stop going long , below Stop_level - stop going short .
Min/Max indicator values are +-100%, but the scale is +-110% just for “easy look”

This version of the Hammering Expert Advisor has no multicurrency trading. Settings: Period_Indicators - averaging period for calculating the trading signals indicator Filter_Indicators - indicator filter setting
Method_Indicators - indicator averaging method Applied_Indicators - applied indicator price TimeFrame_Indicators - chart period for the indicator StopLoss_Percent - loss level, %. The value is set with a minus "-" sign, for example, -33 Trailing_Start - initial trailing level TrailingS
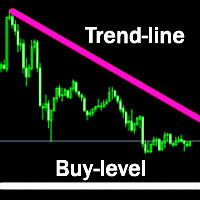
The indicator plots a trend line and determines the levels for opening trades, in case the price goes "too far" away from the trend level. More detailed information is available in the screenshots.
Settings Away from the trend line - distance from the trend line to the trades level; Arrow Signal for deals - enable displaying an arrow when the price reaches the trades level; Size of Arrow - size of the arrow; Alert Signal for deals - enable generating alerts when the price reaches the trades le

The indicator points at the areas of the potential price reversals using alerts.
It is based on the moving average and RSI indicators, and shows their difference. Description of the indicator settings: EMA_Period — The averaging period for the calculation of the Moving Average indicator. EMA_Method — Averaging method. Can be any of the enumeration values, SMA — simple averaging, EMA — exponential averaging, SMMA — smoothed averaging, LWMA — linearly weighted averaging. EMA_Price — applied price

"Just copier" is designed to copy trading without any complicated settings. The copy can be done in one PC. One EA can be set as master (provider) or slave (receiver). The receiver lot can be set to multiple providers lots. Please also check this product at fxina.hostingerapp.com. Any type of copy is available. MT4 -> MT5 MT4 -> MT4 MT5 -> MT5 MT5 -> MT4 If you want to copy MT4 -> MT5 or MT5 -> MT4, please purchase "Just copier" for MT4 and "Just copier" for MT5 separately. Just Copier can copy

The Future Price indicator shows the probable variants of a future price movement based on the searching for matches in the quotes history. The indicator works in two modes: the first iterates over and displays the specified number of variants, the second - the indicator displays one specified variant.
Settings Static_VARIANTS = 0; - display a specific variant; if = 0, iterates over all variants TOTAL_VARIANTS = 20; - the number of variants in the set, not greater than 30 is recommended Time_S

The ACB Breakout Arrows indicator provides a crucial entry signal in the market by detecting a special breakout pattern. The indicator constantly scans the chart for a settling momentum in one direction and provide the accurate entry signal right before the major move.
Get multi-symbol and multi-timeframe scanner from here - Scanner for ACB Breakout Arrows MT4
Key features Stoploss and Take Profit levels are provided by the indicator. Comes with a MTF Scanner dashboard which tracks the brea

Swing High Low Pattern Recognition is a great indicator able to fix price levels and analyze the market swings. Swing High Low uses a dynamic approach of analysis that allows you to identify easily the best entry levels. The indicator using the minimum and maximum periods of the previous candles to analyze the impulsive movement and finally it sets the entry levels. The entry levels are: fast, good and best . The best is the last confirm of the swing. For a correct use we advise to wait the comp

The indicator provides volume delta analysis and visualization. It calculates tick volumes for buys and sells separately, and their delta on every bar, and displays volumes by price clusters (cells) for a specified number of recent bars. This is a special, more descriptive version of the indicator VolumeDelta . This is a limited substitution of market delta (market depth) analysis, which is normally based on real volumes, but they are not available on Forex. The indicator displays the following

inLuk Trade Duplicator is a powerful tool to copy trade locally between multiple broker at different terminal. This is an ideal solution for fund manager or signal provider, who want to share his trade with the others globally on his own rules.
Demo version here ( https://www.mql5.com/en/market/product/20884 )
Features Switchable between Server or Client role within one tool. Easy & friendly interface usage. Drag able panel Customization of user interface using expert input Auto recognize an

The Parabolic SAR Trailing is a utility that provides a trailing stop based on the Parabolic SAR indicator. Moving the stop loss order according to the values of this indicator is considered to be the most popular solutions for trailing, as this trend indicator follows the price. The utility can work with deals on all trading instruments or on the selected instrument. Thanks to the Magic parameter, it is possible to provide joint operation with other experts and management of the stop loss order

Price Action Strength indicator uses the purest form of data available in the market (price action) to indicate the strength of the market move. Reading price action and measuring its strength is a subjective matter and it is a technique that takes years to master. The purpose of the indicator is to make the reading of the price action strength as objective as possible. The indicator is far more advanced then default oscillators, because in addition to the price movement and its direction, the P

EaINDY Stochastic is an Expert Adviser based on Stochastic Oscillator indicator. An order takes place whenever the reversal of the current market price is above the overbought level or below the oversold level. RSI filters are used to ensure that the price will not exceed over the oversold nor under overbought levels. This Expert Advisor is intended for trading EURUSD H4. Terminal - MT4.
Inputs RISK MANAGEMENT Type: Currency: Specifies risk in currency, for example trade for 5% of $5000 balanc

The Gann Box (or Gann Square) is a market analysis method based on the "Mathematical formula for market predictions" article by W.D. Gann. This indicator can plot three models of Squares: 90, 52(104), 144. There are six variants of grids and two variants of arcs. You can plot multiple squares on one chart simultaneously.
Parameters Square — selection of a square model: 90 — square of 90 (or square of nine); 52 (104) — square of 52 (or 104); 144 — universal square of 144; 144 (full) — "full"

The indicator measures the speed of ticks. The number of ticks per second. It is calculated as the number of ticks specified in an input, divided by the time of their appearance. It is possible to disable the audio signals about arrival of ticks using the button with the speaker icon: green - enabled, red - disabled.
Description of the indicator settings number_ticks - the number of ticks to start calculation. The calculation will start only after all the specified number of ticks fully arrive

Phaser Evo is a fully automated trading system. It is designed to take advantage from big and fast movements of the market and it can potentially be used in any kind of financial instrument. It is released with a portfolio of 8 different pairs already optimized, anyway there are no limitations in the development of new configurations. The stop loss is always set but only for safety reason, the robot usually closes the losing positions before stops are reached. When a profit trade is taken, it ca

3xEMA Golden Cross Alert is indicator signal strategy trading by 3 Exponential Moving Average (EMA). It'll alert signal on next bar open with an audio or pop up on the chart when EMA signal cross above/below 3 periods EMA for Buy/Sell and Exit alert signal. BUY/SELL: When Short term's EMA > Medium term's EMA > Long term's EMA = Buy Signal When Short term's EMA < Medium term's EMA < Long term's EMA = Buy Signal Exit: When Short term's EMA < Medium term's EMA > Long term's EMA = Exit Signal for Bu
The Pivot Levels Expert Advisor is based on the Pivot levels indicator. The EA trades a very simple strategy - daily reversal.
Averaging and martingale are used in the process of trading, it trades instant and pending orders, does not use stop loss or take profit. Orders are opened and closed only at a signal.
System settings martingale mode – martingale type. martingale geometric progression – geometric progression step. martingale arithmetic progression – arithmetic progression step. lot
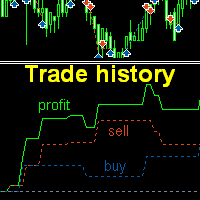
The indicator plots charts of profit taken at the Close of candles for closed (or partially closed) long and short orders individually. The indicator allows to filter orders by the current symbol, specified expert ID (magic number) a nd the presence (absence) of a substring in a order comment , to set the start time and the periodicity of profit reset (daily, weekly or monthly) to calculate the profit chart. The indicator also displays the floating (not fixed) profit of the opened orders at the
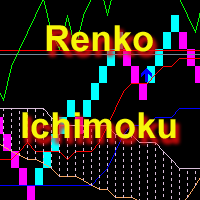
The indicator displays Renko bars, uses their data to calculate and display the Ichimoku Kinko Hyo indicator and provides buy/sell signals. Renko is a non-trivial price display method. Instead of displaying each bar within a time interval, only the bars where the price moved a certain number of points are shown. Renko bars do not depend on a time interval, therefore the indicator works on any timeframe without losing its efficiency. Indicator generates two signals: When the Tenkan-Sen line is ab

Copy Trade Copier Expert Advisor copies orders to several trading accounts (regardless of a broker) if their respective MetaTrader 4 terminals are opened on a single PC/VPS. This resource-saving trade copier features rich functionality, as well as easy and flexible settings. The EA may copy from multiple (unlimited) initial accounts to a single target one or from a single initial account to multiple (unlimited) target ones. The work of other EAs and manual trading on initial and target accounts

The strategy is based on entries according to the Fibonacci levels and the Stochastic indicator. Buys when the Stochastic indicator line is above the specified level and the price is above or equal to the opening level of Fibonacci. Sells at the opposite conditions, when the indicator line and price are located below the specified levels. Designed for 4 and 5-digit quotes, use it on a VPS hosting. Launching the EA It is recommended to launch the EA on several adjacent currency pairs with the sam
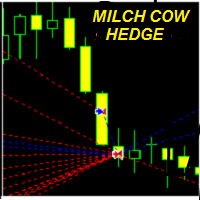
MILCH COW HEDGE V1.12 EA is primarily a Hedging Strategy. Expert support is to seize every opportunity in any direction. Not just opens the deals, but chooses the right time to close the open positions to begin trading again.
We recommend the use of an expert with a pair of high volatility for the currency, such as GBPAUD, AUDCAD Testing expert during the period from 01.01.2016 until 09.12.2016 profit doubled four times to account Experts interface allows the user to directly trading open order

The strategy is based on the Outside Bar pattern. An outside bar is a signal candlestick that completely covers the previous one, including its shadow. If the close price is above the high of the previous candlestick, a buy trade is opened; a sell order is opened if close is below the low. The product is designed for 4 and 5-digit quotes. Use a VPS server Launching the EA It is recommended to launch the EA on several adjacent currency pairs with the same magical numbers. For example: GBP USD , E

The strategy is based on Bill Williams' indicators and my universal template. It uses Alligator, Fractals, AO and AC indicators. Buy entries: the Alligator mouth points upwards, AO and AC are in a green zone, the price is higher or equal to the last "upper" fractal. The product is designed for 4 and 5-digit quotes and should be launched on a VPS server. Expert Advisor Installation It is recommended to launch the EA on several adjacent currency pairs with the same magical numbers. For example: GB

Multi-timeframe Parabolic SAR dashboard allows you to add and monitor PSAR trends. The multi-timeframe Parabolic SAR dashboard will save you a lot of time and gives you a single view of the markets using PSAR. In short, you can just view one window and get a snapshot of up to 21 instruments on your MT4 platform. The indicator opens in a sub-window. Below are the features of the PSAR Dashboard Indicator Modify PSAR Settings: The PSAR Dashboard comes with default PSAR settings of 0.02 (Step) and 0

Pivot Points is used by traders to objectively determine potential support and resistance levels. Pivots can be extremely useful in Forex since many currency pairs usually fluctuate between these levels. Most of the time, price ranges between R1 and S1. Pivot points can be used by range, breakout, and trend traders. Range-bound Forex traders will enter a buy order near identified levels of support and a sell order when the pair nears resistance. But there are more one method to determine Pivot p

This expert trades on price action. It does not use signals from indicators but creates a statistics-based custom channel for entry and exit of trades. Due to independence of indicators, the expert can be optimized for several currency pairs and trading times. Each trade position is protected by stop-loss, both hidden and visible. No martingale, hedging or grid. The expert uses 3 different strategies within the same channel for entry and exit. Each opens only 1 trade at a time. Please find a sig

Yogi EA is scalping Expert Advisor for EURCHF and GBPCHF. The EA performs a complex analysis, which reveals a quiet phase of the market to trade. The Expert Advisor does not use hedging, martingale, grid strategies, arbitrage, etc. Most of the settings are already integrated into the EA code. All you need to do is to select the currency pair, adjust the WET (Western European Time) time zone in the EA parameters and to start trading. Working timeframe - M15. Real account monitoring is available i

Martex is a moderately aggressive EA working on a martingale strategy with hedge. The EA independently monitors the risk and, if the risk is high, takes measures to exit the market with a minimum profit. In the hedging mode, the EA independently leaves the "lock" with a profit. A complete guide to the Martex EA can be found in the "Comments" section. Benefits automatic magic number, individual for each currency pair; automatic breakeven and automatic trailing stop; at high risk, reducing the mar

The strategy is based on the "inside bar" pattern. The inside bar is a candle that fully matches the range of the previous bar. According to the classic definition, the Price Action within the range of the mother bar must contain both the body of the inside bar, and its wicks. Designed for 4 and 5-digit quotes, use it on a VPS hosting. Launching the EA It is recommended to launch the EA on several adjacent currency pairs with the same magical numbers. For example: GBP USD , EUR USD , AUD USD , N

Dolphin EA is a grid Expert Advisor. It opens a grid of orders located at a specified level from each other. An order direction is defined by the built-in filters. No stop loss is used. All orders are closed by take profit. The EA works on any timeframe.
Parameters Filtr - number of points from the average for opening orders (for example, 200). 0 - disabled. AutoTakeProfit - enable take profit auto detection. Take profit should not be less than the TakeProfit parameter. TakeProfit - take profi

NIP Trading is a fully automated Expert Advisor. It works by using several different strategies at the same. Most of the strategies are trend following except for some trend reversal entry points which use Stop Orders when identified. Different strategies use different take profit and stop loss levels as well as trailing stop values, making the expert advisor very flexible to different market conditions. No martingale. No arbitrage.
Settings All trades have stop loss. Some trades have fixed ta

Your Personal Assistant is an Expert Advisor for semi-automatic Forex trading. It is designed for trades who trade manually or prefer semi-automatic trading. Suitable for trading currencies, metals and CFD. The EA helps the trader in managing the open positions, as well as open deals using virtual pending orders based on graphical horizontal and/or trend lines. Thus, positions can be opened by the following method, including their joint use: Market orders (positions are opened by the trader) Pen
The Volatility Pro is a professional indicator for the MetaTrader 4 platform This indicator can be used to calculate the volatility using two methods. It is also possible to apply a moving average to the volatility histogram. This indicator allows to easily identify the bars with high volatility, and it will also be useful for traders who trade the volatility breakouts.
By purchasing this indicator, you will receive: Excellent indicator signals. Free product support. Regular updates. Unique in

The indicator's main objective is to define a trend direction, power and potential reversals calculating the ratio of each candle's squared average price gradient (High-Low). Based on the calculations, the indicator shows: Trend reversal; Trend direction; Trend power. The recommended timeframes are M1 and M5. In this case, the indicator is based on the M15 timeframe trend direction. When working on timeframes higher than M5, the indicator does not use a higher timeframe in its analysis. When sig
The strategy is based on my template and on a simple deviation from the opening price. It is believed that the price continues its movement in the directions of the greatest deviation. It buys when the price moves up by the specified number of points from the opening price. It sells when the price moves down by the specified number of points from the opening price. This strategy is recommended for use on the M30-H4 timeframes. The EA has been adapted for four- and five-digit quotes. VPS server i
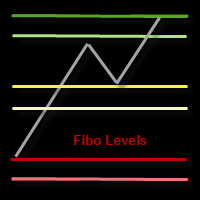
This indicator draws the Fibonacci -38.2, -17, 38.2, 61.8, 117, 138 levels for the last closed H1, H4, Daily, Weekly and Monthly candle.
Features Automatic display of the most important Fibonacci levels.
Parameters TimeFrame: Choose which timeframe you want Fibonacci levels to be based on.
SetLabels: Visible/invisible Fibonacci level labels.
Labels Position : Position of Fibonacci level labels (Right - Left - Middle).
FontSize: Font size of Fibonacci level labels. c38: Color of level 3
Work order The EA works on any timeframe and any currency pair. During operation, the EA analyzes a wide range of variables and indicators. Once necessary conditions occur, the EA opens a pending order. The EA doesn't open another order until you the previous one is closed. The EA contains the TrailingStop block, enabling you to move STOPLOSS following the price movement. The EX performs most effectively on EURUSD, GBPUSD, USDCHF, but also can be used on any other currency pair. For best result,

The Fx-PIOT indicator determines the movement direction of a financial instrument using a combined signal: the main signal + 2 filters. The screenshots were taken in real-time mode (/ Date=2017.01.24 / Symbol=NZDJPY / TF=H1 /). The main signal is displayed as arrows (Up / Down) + possible reversal zones. Calculation is made using the Open, Close, High and Low prices. Filter #1 is a trend filter determining trend on the D1 time-frame; it outputs a message: "Buy Signal" / "Wait for Signal" / "Sell
When using CCI (Commodity Channel Index) oscillator, the waiting time till the next signal can be long enough depending on a timeframe. CCI Alerts indicator prevents you from missing the indicator signals. It is a good alternative for the standard CCI indicator. Once there appears a CCI signal on the required level, the indicator will notify you with a sound or push, so you will never miss an entry. This is especially significant if you follow the indicator in different timeframes and currency p

Closing Orders At Specified Time is a utility which helps you to close opened orders and delete pending orders at a specified time - especially when you cannot be online and do it by yourself at that time. You can schedule a specific time for closing orders, and additionally you can choose what type of orders should be closed (all, only opened or only pending), what symbols (all or you can enter names of three symbols) and with what Magic Number. You can also select to close only profitable or o
Trade double tops and bottoms effectively
The PZ Double Top/Bottom Indicator is a technical analysis tool that helps traders identify potential price reversal patterns in the market. These patterns, known as double tops and bottoms, are characterized by two consecutive peaks or valleys in the price of an asset. Double tops and bottoms are often seen as potential reversal patterns because they can signal a change in the direction of the current trend. [ Installation Guide | Update Guide | Troub

ReLSOved indicator is primarily directed at traders using trading strategies based on the price action patterns. The indicator knows exactly where the rails go! The "rails" are the five patterns of the famous Price Action strategy - Rails, Outside bar (OVB), Reversal pivot points (PPR), Wide range bar (WRB) and Inside Bar False BreakOut - IB-FB, which is known as Fakey among the fans of Price Action trading. They can be used together or in various combinations (the display of each pattern is cus

The indicator Box Chart is a very useful analysis tool that allows you to know the value of the range in points. The range is written in a label and also it is draw in a rectangle. This indicator works on multi timeframe and you can upload more indicators on same chart to analyze more time frames ranges. The analysis of the range is done following W. G. Gann school. The observation of the range on little time frame returns some good information of trend or reversal. Box Chart is a simple indicat
The Expert Advisor for trading GBP/USD M5. It is based on the strategy of microtrend detection, market entry (and exit) points are calculated based on the correlation of indicators. The trading volume for opening a position depends on results of previous trades. It is possible to limit the amount of risk (the AutoMM parameter). It is also possible to set the maximum spread, above which the EA will automatically suspend trading (the MaxSpread parameter). It uses an efficient trailing, which autom

The Intraday Momentum Index ( IMI ) is a technical indicator that combines aspects of Candlestick Analysis with the Relative Strength Index ( RSI ). The Intraday Momentum Index indicator concept remains similar to RSI and includes the consideration for intraday open and close prices. The IMI indicator establishes a relationship between a security open and close price over the duration of a trading day, instead of how the open and close prices vary between different days. As it takes into conside
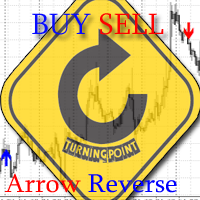
The indicator shows the market reversals as arrows. The reversal signals are based on observation of the market behavior. It is based on the principles of searching for extremums, volumes and Price Action. The indicator provides signals on the following principles: Search for the end of the ascending/descending trend Search for the reversal pattern based on Price Action Confirmation of the reversal by the contract volume. The indicator also features an alert triggered when the arrow appears. The
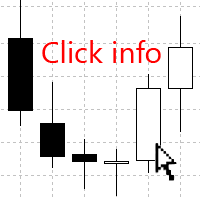
The Click Info is a simple utility that allows the trader to quickly receive information about the High, Low, Open, Close, Time values of the current chart. In order to receive information about a bar, it is necessary to left-click the selected candle. Depending on the settings, either a pop-up Alert or a Comment with the information appears. Information on the bar values (High, Low, Open, Close, Time) can be extremely useful in practice of trading using graphical analysis, evaluation of the Pri
If you use the MFI (Money Flow Index) indicator, the waiting time till the next signal can be long enough. Now you can avoid sitting in front of the monitor by using MFI Alerts. This is an addition or a replacement to the standard MFI oscillator . Once there appears an MFI signal on the required level, the indicator will notify you with a sound or push, so you will never miss a signal. This is especially significant if you follow the indicator in different timeframes and currency pairs, which ca

You can avoid constant monitoring of computer screen waiting for the DeMarker signal while receiving push notifications to a mobile terminal or a sound alert on the screen about all required events, by using this indicator - DeMarker Alerts. In fact, it is the replacement of the standard indicator with which you will never miss the oscillator signals. If you don't know the benefits of DeMarker or how to use it, please read here . If you need signals of a more popular RSI indicator, use RSI Alert
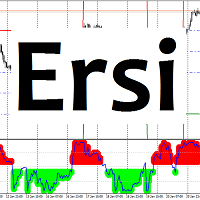
Ersi The indicator shows overbought and oversold zones. Zones can be adjusted by levels, set in the settings. Settings: Period_I - averaging period for calculating the indicator; Applied_Price - used price; Percent_Coefficient - percentage coefficient; Count_Bars - the number of bars to display the indicator; Overbought_level - overbought zone level; Oversold_level - oversold zone level; Overbought_color - color of the overbought zone; Oversold_color - color of the oversold zon
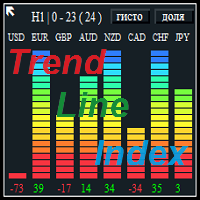
The Trend Line Index is a multi-currency indicator that shows the strength of a currency at the moment or for any period of history data.
Description of strategy and operation principle The indicator constantly analyzes 8 currencies or the ones that make up the 28 currency pairs . In the settings you can choose the period to analyze the movement you are interested in. To do this, select the timeframe, the number of the analyzed bars in the settings, as well as the number of the bar to start th

AMD Exclusive characterized by high efficiency and can constitute a complete system. Indicator based on Price Action, Statistics and Overbalance. We encourage you to study indicator on its own until you know the tendencies of how it behaves relative to price movement. Indicator automatically optimizes time frame M15, M30, H1, H4, D1 and W1 (press the button [O] on the chart). Filter OVB (overbalance) has three modes: Manual [button F on chart]. Semi-automatic [button F on chart]. Automatic [butt

The indicator calculates and displays Renko bars using Bollinger Bands and Parabolic SAR data as well as provides buy/sell signals. Renko is a non-trivial price display method. Instead of displaying each bar within a time interval, only the bars where the price moved a certain number of points are shown. Renko bars do not depend on a time interval, therefore the indicator works on any timeframe without losing its efficiency. The buy signal is generated when the average line of Bands is directed

The strategy is based on my template and based on Envelopes and the last candles' sequence. The EA has been adapted for four- and five-digit quotes. VPS server is recommended. Check the parameters on 99.90% quotes at least for the last year before launching the EA on a real account. Feel free to write me a personal message if you need my help. Parameters Inp_Period – indicator period; Inp_Method – averaging method; Inp_Price – price type; Inp_UpperDev , Inp_LowerDev – deviation in %.
EA templa

Tribal EA is the newest conservative trading Expert Advisor with a powerful order control filter, the development of which took the last six months. The EA does not use martingale, averaging or similar risky techniques. It always uses stop loss, tale profit and order closure based on additional filters. All appropriate settings are stored in the Expert Advisor code, so there is no need to download additional set files - you only need to attach the EA to recommended pairs. The settings are valid

A scalper system only work during Asian hours. Several unique indicators to detective the price fluctuation. Dynamic TP/SL level according to market conditions. Fixed stop loss to protect the capital, very low risk of losing a lot of money. No need to obtain SET files. The parameters are the same for each currency pair. It is optimized to work on GBPUSD . It is recommended to use it on M15 chart. It is recommended to run it on FBS Zero Spread Account . It is recommended to do 99.9% modeling qua
This Expert Advisor trades based on trend lines, as well as on the basis of volume analysis. Volumes are calculated using minute bars, in order to determine if they were ascending or descending. The trend lines are drawn based on High and Lows in the trade history. There are also additional indicators. Buy or sell signals depend on all those factors. This allows the EA to enter the market with more accuracy and to perform more deals.
Input parameters Lots - lot size (if 0, a lot is calculated
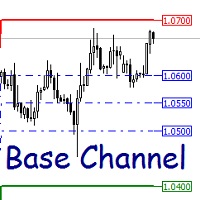
The indicator plots dynamic support and resistance levels. Description of the indicator settings: Channel_expansion_coefficient - channel expansion ratio
Main_Level - boundary size to recalculate the indicator levels ArrowRightPrice - enable/disable the display of the right price labels color_UP_line - color of the upper resistance line color_DN_line - color of the lower support line color_CE_line - color of the central lines style_ - style of the central lines width_ - width of the central li

The strategy is based on my template and is based on the Fractals, Bollinger Bands and ZigZag indicators. The EA has been adapted for four- and five-digit quotes. VPS server is recommended. Before installing on a real trading account, it is recommended to test the parameters on 99.90% quotes at least for the last year. If you need any help, send me a private message. Parameters of signals Inp_BandsPeriod – period of the indicator; Inp_BandsDeviation – the number of standard deviations; Inp_Bands

Features All in One indicator is a simple indicator. It makes you know about eight indicators in all timeframes at just one view in the same time. Stochastic RSI Moving Average (MA) Parabolic SAR ADX MACD CCI Last Candle (Candle) in all timeframes (M1, M5, M15, M30, H1, H4, D1, MN) in the same time.
Parameters Stochastic PercentK : period of the %K line. PercentD : period of the %D line. Slowing : slowing value. RSI RSIP1 : period 1 RSIP2 : period 2 Fast Moving Average MA averaging period: ave
The indicator works when there are open orders present in the market. It calculates the price, upon reaching which the total profit of all open orders will be equal to zero, the breakeven level. The calculation takes into account the orders of the currency pair the indicator is running on. Orders can be filtered by the magic number. Description of the indicator settings: Line_Create - display the breakeven line color_Line - line color style_Line - line style width_Line - line width Text_Create -

This indicator depends on some secrets equations to draw Signals with Stop loss and maximum 4 Take profits. There is a free EA depends on this indicator as a gift when you purchase/rent it.
Features Simply it gives you entry point as Ready sign (Buy / Sell) and arrow (Buy / Sell) after candle closed, also SL line and 4 TP lines or less. Once SL-TP lines are shown with the arrow, they remains as they are until signal change. It is historical indicator. No Repaint. user manual for V5 please cli
The MetaTrader Market is the best place to sell trading robots and technical indicators.
You only need to develop an application for the MetaTrader platform with an attractive design and a good description. We will explain you how to publish your product on the Market to offer it to millions of MetaTrader users.
You are missing trading opportunities:
- Free trading apps
- Over 8,000 signals for copying
- Economic news for exploring financial markets
Registration
Log in
If you do not have an account, please register
Allow the use of cookies to log in to the MQL5.com website.
Please enable the necessary setting in your browser, otherwise you will not be able to log in.