Watch the Market tutorial videos on YouTube
How to buy а trading robot or an indicator
Run your EA on
virtual hosting
virtual hosting
Test аn indicator/trading robot before buying
Want to earn in the Market?
How to present a product for a sell-through
Expert Advisors and Indicators for MetaTrader 4 - 117

ABCMarketsControl.ex4 utility manages already opened trades on any symbol by moving them to a breakeven when the price reaches a certain level. Besides, if the price goes further in favorable direction, the utility moves Stop Loss and Take Profit accordingly. The utility is most convenient for use on medium and long terms, as well as when trading on news. The parameters set by default are optimal, but it is better to select them individually for each trading symbol according to personal experien

This Expert Advisor operates based on fractals and trade volumes, as well as other indicators. It is a more advanced version of Three Fractals , as it is able to analyze the trade volumes and features dynamic placement of take profit and stop loss depending on the current trading activity. The trading strategy remains the same (based on formation of several fractals), but slightly improved, additional parameters have been added.
Input parameters Lots - lot size (if Lots=0, then the lot will be

Gegatrend EA is a cost averaging system with a sophisticated algorithm. It is secured by a built-in “ News WatchDog ” that suspends trading during news events. For full description: https://www.mql5.com/en/blogs/post/711269 Watch how it works: https://youtu.be/j17AR3uq6yI
Parameters SR timeframe long — timeframe for support/resistance leveling long direction. SR distance long — minimum distance in pips between long trades. SR level long — the number of trades to start using SR levels for long d

The Ultimate USDCAD Expert Advisor is an automated system that fully controls the process of trading, requiring no interference from the trader. MQL5 Signals: https://www.mql5.com/en/signals/359190 Advantages of the Ultimate USDCAD EA: It does not use risky trading methods: martingale, averaging, grid, night scalping. It consists of a set of various strategies, which makes the trading more diversified and secure. Every trade is protected by stop-loss. This Expert Advisor can be used with any bro

Parabolic SAR strategies EA is a Parabolic SAR EA that can support multiple strategies. Purchasing this EA can save you the time taken to automate your existing PSAR strategy through coding a custom EA and it also helps you discover profitable Parabolic SAR strategies as its fully compatible with the strategy tester and all settings are editable. The EA supports both scalping, short term and long term strategies. The various supported settings are explained below: NOTE: The default settings in t

This is a multi-currency author strategy, designed for trading on the M1, M5, M15, М30, Н1, Н4. Entry points are calculated using custom formulas and algorithms that allow you to effectively determine current trend in the market, obtain the entry points (buy/sell) and the optimal levels to close orders. The Cosmic Diviner Scalper System indicator can be used on any Forex pairs. The detailed guide on how to use the indicator is provided in the blog: https://www.mql5.com/en/blogs/post/719602 A hug

Expert Advisor for night scalping. It works at the end of the American and at the beginning of the Asian sessions. Working time frame - M15 and M5. The EA features a news filter, which uses a news indicator. NOTE : The settings in the proposed set files are designed for brokers working according to Eastern European Time and New York trading time. When using with a broker that works according to a different time, it is necessary to manually adjust the EA operation time in the input parameters. ND

This indicator displays the trend movements.
Parameters XRMultiplier1: XR multiplier 1. XRMultiplier2: XR multiplier 2. Line1: line 1 movement (true/false). Line2: line 2 movement (true/false). XRTrend: XR trend displays Line 1 and Line 2 movements (true/false). X: move the trend left and right. Y: move the trend up and down. How to understand the status: If the Line is green, trend is up. If the Line is red, trend is down.

The EA for manual trading to manage open positions and pending orders.The built-in trailing stop has four modes and seven instruments. There is a virtual stop loss and a virtual take profit, which can be freely moved around the chart.Three take profits, which, when triggered, reduce the volume of the lot by a set percentage. With the help of the built-in trading simulator, you can check how the EA works in the strategy tester. Autumn price reduction by 10%! Until October 1st only! Manual to UTra

Speedster EA is a fully automated expert advisor. No required technical or fundamental analysis. The EA opens and closes all of trades. That manages all of processes. The strategy based of OBOS levels at both of short and medium timeframes in the same time. That uses 2 indicators and moving averages to calculate the price.
Advantages NO Grid, Martingale, Averager and high risk strategies. The EA always uses Stop Loss and Trailing. Dropdown style Money Management can be set easily. Also, fixed l
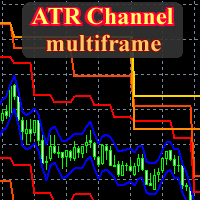
This is a fully multitimeframe version of the ATR Channel standard indicator, which works for any combination of timeframes. The indicator allows viewing price channels from different timeframes in one window, and they will always be displayed in a correct time scale. You can create and set of intervals and freely switch to a higher or lower one. Please note: in the " From Median Price " display mode, it is easy to identify reversal points at intersections of levels from higher timeframes by lev
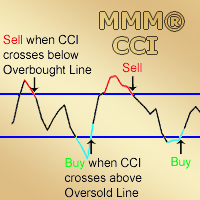
MMM Commodity Channel Index Strategy: The robot uses its two built-in improved and tested CCI indicators to determine the prices trends and calculates the signal for buying or selling. It sends an order, closes or moves the Trailing Stop loss position as the indicator works. Perfect for scalping. It will not send an order unless the calculations determine a good trend of profit. Like all MMM products, it is also programmed to minimize your losses and protect your money from the hostile market. W
Автоматический советник предназначен для торговли новости Nonfarm Payrolls. Торгует советник один раз в месяц при выходе новости, новость ищет и скачивает с сайта Investing.com. Советник мультивалютный устанавливается только на один график, валютная пара любая, таимфрейм любой. В настройках советника установлены для торговли эти валютные пары (USDJPY, GBPUSD, EURUSD, USDCAD, NZDUSD, AUDUSD) список валют можно редактировать добавлять либо удалять нужные валюты для торговли. Для работы советн

The Candle Patterns indicator provides a visual display of candlestick patterns. There are more than 100 patterns that can be displayed. The indicator allows for candles on the chart to be grouped and considered as one candle. This allows the price action within a candle to be observed in the context of a candlestick pattern. The number of bars per candle can be set in the parameters. All patterns can be filtered so that only patterns with certain attributes are displayed. The prior trend is tak
Rubicon EA is a fully automated trend-following Expert Advisor for trading EURUSD. The strategy of the EA is designed for medium-term trading, which ensures stable operation regardless of the trading conditions (spread, slippages, execution speed) and the current market situation.
Advantages of Rubicon EA It can work with any broker and any account type. There are no prolonged periods of stagnation. The EA is self-optimizing, adjusting to the current market conditions. Does not require any know

HeatMap MT4 allows traders to see inside the charts. This indicator plots congestion zones over a certain period of time, known as "Lookback", by analyzing thousand of variables simultaneously. These spots act like strong supports and resistances and now are easy to see. HeatMap MT4 works with all timeframes and all instruments.
Settings Computations - define whether the algorithm works continuously or only at the opening of each candle (default: New Candle). Lookback in Bars - define the perio
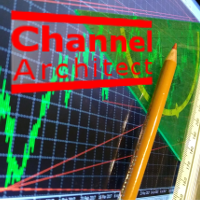
This utility calculates and draws lines over the chart. There are two types of channels: Channel A: the mainline is drawn using local Lows for uptrends and local Highs for downtrends. Channel B: the mainline is drawn using local Highs for uptrends and local Lows for downtrends. The parallel line of both types is built, using the maximum fractal between the base points of the mainline. There are few conditions which have to be fulfilled and can be changed in the parameters (see also picture 4): T

The Main EA Features Trading is performed using a grid of Buy and Sell orders. A strict Stop Loss level is set for each order to limit the losses. Multicurrency trading is supported. It is not susceptible to large delays and spread value. Monitoring of my accounts: https://www.mql5.com/en/signals/author/mizrael
Operation Principle The EA opens a grid of Buy and Sell orders with spacing between them set in the Step parameter. Once the sum of orders in either Buy or Sell direction becomes equal
The 'HLOC Cross' was created to show crosses of historical highs & lows Key Features This indicator looks for a custom pattern of 3 bars with a bars filter. There are many visual options available to choose from (bar count). Non-repainting trendlines & arrows: arrows either at bar 0 or bar 1.
Input Parameters Bar Count = 3000 - all bars on chart or only a select few bars displayed. Bar Buffer = 1 - pattern taken from selected bar, minimum is bar 1. Lines Visible = true - trendlines displayed
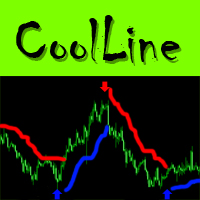
CoolLine is a signal indicator displaying on a chart points for opening and closing trade positions. The indicator signals are not redrawn. It draws arrows on the zero bar Open[0]. It works on all currency pairs and all time frames.
Indicator Advantages Precisely shows the opening and closing points on the chart Does not redraw signals Works on all currency pairs and timeframes Very easy to use; suitable even for beginners Has a very flexible system of settings Can send push and email notificat

Fix M15 is a fully automated short-term trading robot. The EA does not use hedging, martingale, grid strategies, arbitrage, etc. Fix M15 opens a trade during the Asian session in a narrow channel defined by MA and RSI indicators. Only one trade per one pair can be opened on the market at each given time. It can be closed by a certain TP, SL or after a certain time (set in the EA settings). Basic EA settings are configured for trading GBPUSD М5 for the terminal set to GMT+3 (summer time). The EA

The Wing Patterns indicator scans for many different kinds of Patterns using an XABCD structure. The term Wing Pattern is used to refer to all types of patterns based on a general XABCD structure, which is plotted in an alternate high-low extreme form. In other words, assume that point X is started at a low point on the chart. The point A is plotted at the next highest point within a certain number of bars. This certain number of bars is called the depth level. In this example, point B would be
Market Scanner Elite is a new generation of indicators of the Market Scanner series. The Elite version features an improved market analysis algorithm, with a better identification of the entry points and filtering of the false signals. The logic of market analysis and calculation of effective entry points applied in this product are significantly different from those applied in Market Scanner . This indicator cannot be called a big brother, as it is a completely new product with innovative analy

Magic Pivot is a professional indicator for finding the support and resistance lines; it has been developed by a group of professional traders. The indicator plots three support lines and three resistance lines, where a price reversal is highly probable. Magic Pivot is an excellent tool for scalping and intraday trading. Advantages
High accuracy of signals. Suitable for scalping and intraday trading. The indicator does not redraw. Simple indicator setup, minimum parameters. Works on any financ
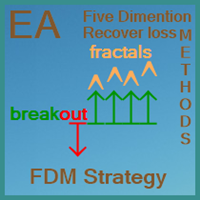
FDM Strategy is an Expert Advisor based on fractals and five dimension method. Five Dimensions expert system is developed based on a theory combining the Chaos Theory with the trading psychology and the effects that each has on the market movement. There is also an ADX (measuring trend strength with average directional movement index) used as a trading filter. Long and Short Trade Signals: If fractal to buy is above the Alligator's Teeth (red line), the pending Sell Stop order must be placed 1 p

Expert Advisor Overview and Advantages The strategy is based on the support and resistance breakout principle; The EA uses only Buy orders. The EA always uses Take Profit and Stop Loss. Multicurrency trading is supported. Easy of use. Wide choice of suitable currency pairs; Minimum initial deposit.
Operation Principle Based on the data of two indicators (the first is RSI with a period of 14, the second one is custom built-in indicator), the EA opens a buy order and sets the Take Profit and Stop

The indicator displays the key support and resistance levels on the chart. The significance of these levels lies in that the price may reverse or strengthen the movement when passing such levels, since they are formed as a consequence of the natural reaction of market participants to the price movement, depending on which positions they occupied or did not have time to occupy. The psychology of the level occurrence: there always those who bought, sold, hesitated to enter or exited early. If the

Optimizes the value of overbought and oversold on each new bar. This expert strives to choose the best values for a simple strategy where it sells when the indicator crosses below an overbought level and executes a buy when it crosses above an oversold level. The best overbought and oversold level is calculated on each new bar according to how that value would have performed during the optimizing periods which can be specified.
Inputs Unique number for this EA - can be any integer value. Optimi

LevelUP is a fully automated Expert Advisor trading robot. It applies cutting edge "Key level Break Out" strategy. Slippage and trade execution delay can’t be avoided for breakout trading system. However, LevelUP applies pending orders instead of market orders to improve those issues. Also, LevelUP implements algorithms for limiting its trading hours and you may specify the most effective trading hours based on your optimization. And there is trailing stop system to secure accumulated profits. W
The RSI S-RoC indicator differs from the standard RSI in that it takes into account the price rate of change when calculating values. When the price moves in a trend, the indicator produces good entry signals oncethe price touches its levels. The level values can be configured in the indicator settings. They can also be modified and adjusted directly in the indicator window. You can also set on a chart signal lines. Once they are crossed, the indicator will produce a sound alert or play a user

The indicator compares pattern found on chart history with the current price movement. Since history repeats itself, then, by comparing the two patterns, indicator can predict the further movement of the price. The indicator allows you to overlay highlighted history pattern with current movement and you will visually see this movement and will be able to compare the past and the present. To compare two patterns, you need: It is necessary to find and highlight a pattern on the history chart of a

Extract Candle Power is a real time volume extractor indicator that provides valuable insights into the behavior of sellers and buyers during each candle. By analyzing the volume data, traders can make more informed decisions about market trends and potential reversals, surpassing the capabilities of traditional Moving Average indicators. This powerful tool allows you to extract and analyze the sellers and buyers volume of the current candle, as well as compare it with the volume of previous can

This EA trades mainly in the London and New York Sessions of the market. Forex Agent A is a day scalper with a bigger stop loss and a smaller take profit. Trades are opened at the first tick of the bar. In case of extended drawdown, take profits are adjusted to exit the market sooner and if at all possibly profitable. The built-in news filter prevents the opening of new trades when important news is upcoming. Entry points are determined exclusively by various indicators. Trade exits determined e

Currencies Cleaner panel will give you an overview of all the most traded market's currencies in a single click. First of all the panel will refresh all your charts, opening them four times in all timeframes needed.
1 - CURRENCIES It uses a complex algorithm to study the movement of 17 different indicators. It means that the algorithm not only "reads" the actual value of an indicator, but also creates a probability of success using the position of this value on the indicator and the last moveme

Quantum Theory is a fully automated Expert Advisor based on the principle of scalping in the distribution of data in the sample and the distance between individual data points to the mean or average sample values. In Statistics, the data area between +/- 1 standard deviations will be 68.2%, the data area between +/- 2 standard deviations will be around 95.4%, and the data area between +/- 3 standard deviations will range from 99.7%. The Expert Advisor works with Stop loss, The Larry Williams Per

This indicator scans for you up to 30 trading instruments and up to 8 timeframes for occurrences of the high probability reversal patterns: Double Tops/Bottoms with fake breakouts . Please read also the blog post " Professional Trading With Double Tops/Bottoms And Divergences! " which explains the concepts behind the ULTIMATE Double Top/Bottom indicator and how you can use a professional top-down approach. You can get alerts via MetaTrader 4, email and push notifications at the moment when a sig

The indicator uses the Envelopes channel in its calculations, which allows working with dynamic support and resistance levels. It also considers the direction and strength of the trend, as well as the mathematical calculation that determines the percent range of the price channel, which is generally formed at the time of the accumulation of positions. It first generates a preliminary signal in the form of a round arrow. Then it is necessary to wait for a normal arrow and enter the market only af

Introduction to Smart Trade Price Action Expert Advisor
Smart Trade Price Action is an Expert Advisor (EA) with a flexible and diverse trading strategy, operating across 15 currency pairs on the All timeframe. This approach enhances the chances of sustainable growth while reducing the risk of relying on a single pair or individual trades. Risk management is strictly controlled, ensuring the safety of your capital.
With a simple setup, Smart Trade Price Action requires no specialized knowledg

The Master Figures indicator analyzed the market for the most common chart patterns. The first pattern is called Pin bar . This pattern can rightly be considered one of the most widespread. This pattern looks like a candle with a small body and large tail (wick). Once you see it on the chart, open a position against the wick. It is better to use the resistance lines for closing. Master Figures shows this pattern in the form of circles. A position should be opened when a new candle appears after

ReviewCandleChart is a unique product that can verify past price fluctuations using candlestick charts. This indicator accurately reproduces market price fluctuations in the past and can make trading decisions (entries, profits, loss cut) many times so that you can learn the trading faster. ReviewCandleCahrt is the best indicator to improve trading skills. ReviewCandleCahrt caters to both beginners and advanced traders. Advantages of the indicator This Indicator for verifying price fluctuation u

The indicator is designed for determining Fibonacci levels. Does not repaint/redraw The blue level shows the zero Fibonacci value (it is also the Pivot level) Red levels show calculated Fibonacci levels (used as a rollback or reversal point) Automatic period detection (periods can be entered manually) Adjustable display calculation method. Settings BarsHistory - the number of bars to be used to display the indicator. Method - method of calculation. AutoPeriod - automated period calculation (true

White Scalper is a fully automated Expert Advisor that uses a highly accurate scalping strategy. It works on all symbols and timeframes.
White Scalper advantages Flexible settings allow you to use the EA on virtually any instrument. No long stagnation period. Good testing results since 2000. No outstaying the losses. All trades are closed within a few hours. The Expert Advisor does not use hedging, martingale, grid strategies, arbitrage, etc. A stop loss is always set.
About Extreme settings T

The Expert Advisor is based on the principles of Parabolic SAR indicator and uses the elements of the hedging strategies. This mechanism uses the momentum of trading volatility that works on all the timeframe, day trading and swing trading. If two Parabolic SAR dots are below the price they represent the buy signal, and if the two Parabolic SAR dots are above the price they indicate the sell signal. This algorithm uses a hedging strategy that works with the volatility zone system, which we apply

The TrendsAssistantMt4 indicator is shown in a separate window in the form of rhombi of different colors: red rhombi indicate a drop in the price, green ones signify a growth. Two rhombi of the same color in a row serve as the trade signals. The indicator should be attached to a chart of any timeframe and any trading symbol.
Parameters Per - period for calculation. The greater the period the longer the indicator is calculated and the less the number of false signals.

Openology is a very simple indicator that can show the historical information of the opening price levels. The histogram has in fact the task of showing the history of this value in order to study the conditions of permanence and duration of this very important market condition. The indicator, in separate window, is not intrusive and through its internal customization extremely simple in use. Very important is the possibility to enable or disable a timeframe to show the agreement of study on Ope

This indicator draws Fibonacci level automatically from higher high to lower low or from lower low to higher high combinate with Pyramid Trading Strategy for better risk reward ratio. With adjustable Fibonacci range and has an alert function.
What is Pyramid Trading Strategy? The basic concept of pyramiding into a position is that you add to the position as the market moves in your favor. Your stop loss moves up or down (depending on trade direction of course) to lock in positions. This is how

The Expert Advisor trades using trendlines. You should draw a trendline on a chart. The name of the line should be in the following format: "Trendline" space digits. This is the default name used when a line is drawn on the chart, please do not change it. The EA supports two types of trading using the trendlines: a breakout strategy and a roll back strategy. A trade signal is generated on the last but one bar (the completed one), if its open price is below/above the trendline and its close price

This long-term trading system works on 12 pairs and 4 timeframes . The Expert Advisor uses various trading systems, such as trend trading, counter-trend trading and others. This increases the chances of sustained growth and reduces exposure to a single pair or individual operations. The risk is tightly controlled.
/>
The EA has the built-in smart adaptive profit taking filter. The robot has been optimized for each currency and timeframe simultaneously. It does not need arrival of every tick and

BinaryIndicator is a highly accurate indicator for trading binary options. It shows excellent results in scalping. This indicator is based in multifactor analysis of trend indicators, as well as confirmation oscillators, which in the end gives an increased accuracy of signals.
Advantages of the indicator Increased accuracy of signals. Excellent results when trading binary options with a short expiration time from M30 to M1 . It works on any timeframes. Works with any trade symbols.
Parameters

This oscillator is smooth as the name implies. It also shows hidden divergence arrows. The indicator also has multi timeframe features to make it very flexible to use. The multi time frame features can be adjusted as follows: 1 or M1, 5 or M5, 15 or M15, 30 or M30, 60 or H1, 240 or H4, 1440 or D1, 10080 or W1.
Indicator parameters Timeframe - When set to 0, works on the current timeframe. Draw Divergence arrows - If set to True allows divergence lines to be drawn. Display Alert - If set to True

Some traders experience difficulties when it comes to limiting risks. This indicator helps traders define a suitable stop loss to limit trading risks. The indicator provides seven levels of risk limitation (recommended values are 1-3). The greater the risk, the greater the stop loss. Accordingly, the lower the risk, the smaller the stop loss, but the greater the probability of false triggering. In addition, the indicator shows trend signals and the current trend strength. This data can be used t
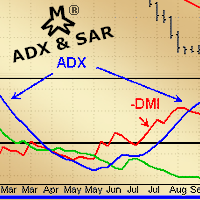
MMM ADX & SAR strategy: As requested by some experienced traders, this EA's strategy uses its 2 built-in indicators to enhance its signals and decide to open a new order at the right time, there is an ADX indicator and you may choose its signal's strength, a parabolic SAR to help and confirm the trends and a MA to check if the prices are deviating from its pattern. By joining both indicators' data and the moving average, it is possible to calculate a good and strong trend direction, avoiding sud

This indicator is a proof of concept of pyramid trading strategy. It draws fibonacci level automatically from higher high to lower low or from lower low to higher high combinate with Pyramid Trading Strategy for better risk reward ratio. What is Pyramid Trading Strategy? The pyramid forex trading strategy is a something every forex trader should know about because it makes the difference between making some pips with some risk in only one trade or some pips with less the risk by applying the pyr

The product is based on a number of standard indicators. It shows strong trends on large timeframes – H4 (recommended) and higher. I recommend using confirming indicators on lower timeframes for trading. The product works on any symbols. Low volatility symbols are recommended.

This indicator is a multitimeframe trading strategy. It has the levels for stop loss, take profit and entry point. The order level can also be set manually. The indicator uses the regularity of the market, which manifests itself on all instruments, and does not require adjustment of the parameters. The strategy uses a proprietary approach to determining: trend, volatility, hierarchy of timeframe significance, the size of the history period (the number of candles), which is important for making a

Introducing Early Morning Scalper ATR: Precision Trading During Asian Forex Market A breakthrough in forex trading automation, the Early Morning Scalper ATR Expert Adviser offers a fully autonomous solution meticulously engineered for a specific window of opportunity—the early hours of the Asian Forex market. At its core, this innovative tool employs an advanced algorithm that orchestrates forex trading seamlessly. Augmenting its prowess are sophisticated internal indicators, which deftly ident
Based on candlesticks patterns. Different candlesticks patterns included with buy and sell on pattern recognition without stoploss and limit. Sell at peaks and buy at bottoms or follow a trend. A simple EA based on century old chart patterns. EA also uses extensions to established patterns and takes more than one buy or sell trades following a buy or sell trade and closes all previous buy or sell trades on a reverse pattern.

This Expert Advisor is designed for working with all major currency pairs on all timeframes (M1-D1). Micro Martingale is a flexible concept of Martingale, which can work as Full Martingale (Average closing) or Martingale combined with trailing, stop loss and take profit, depending on parameter settings. Orders are triggered based on mathematical algorithms of price correction/reversal. The Expert Advisor will work better during high fluctuations.
Warning Martingale System is at high risk. For t

With My Fx STATISTICS you will be able to see your account´s performance directly on the chart of Metatrader 4, and refresh the data even every minute. No need of external analyzer webpages. Information provided: DAILY, WEEKLY AND MONTHLY PROFIT. PROFIT FACTOR % OF PROFITABLE TRADES AVERAGE PROFIT / LOSS TRADE (MONEY AND PIPS) BEST PROFIT / LOSS (MONEY AND PIPS) EXPECTANCY (AVERAGE PIPS PER TRADE) AND ALSO YOU WILL SEE THE ACTUAL PROFIT OF EACH CURRENCY PAIR
Input parameters
Refresh_data_minute

The Expert Advisor has a signal filter consisting of two parameters, which evaluates the overbought and oversold states of a financial instrument. It is possible to configure all essential parameters for buy and sell trades separately or to disable one of the directions for a greater flexibility in trading. To complete the EA operation correctly, the "Stop EA" button is provided. Once pressed, it raises the flag to prevent opening orders on new signals. Averaging with certain limitations is used

This indicator shows the main trend on the current chart.
Features This indicator includes two bands, one is the inner white bands, another is the outer blue bands. If the white dotted line crosses down the white solid line, this means that the trend has changed to be bearish. If the white dotted line crosses up the white solid line, this means that the trend has changed to be bullish. Once the crossing happened, it will not repaint.
Settings ShowColorCandle: if 'true', it will show the color
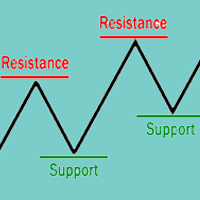
The concepts of support and resistance are undoubtedly two of the most highly discussed attributes of technical analysis and they are often regarded as a subject that is complex by those who are just learning to trade. This article will attempt to clarify the complexity surrounding these concepts by focusing on the basics of what traders need to know. You'll learn that these terms are used by traders to refer to price levels on charts that tend to act as barriers from preventing the price of an

This indicator is different from the conventional indicator by an additional set of parameters. The ADX line changes color depending on the location of the +DI and -DI lines relative to each other.
Indicator Inputs Period — indicator calculation period; Method — select the averaging method: simple, exponential, smoothed, linear-weighted; Apply to — select the applied price: Close, Open; High; Low; Median; Typical; Average Weighted; By default, the directional lines are colored in the following

Magic Moving is a professional indicator for the MetaTrader 4 terminal. Unlike Moving Average , Magic Moving provides better signals and is able to identified prolonged trends. In the indicator, you can set up alerts (alert, email, push), so that you won't miss a single trading signal. MT5 version can be found here You can test the program by downloading the demo version: https://www.mql5.com/en/blogs/post/749430 Advantages of the indicator Perfect for scalping. Generates minimum false signals.

The Commodity Channel Index (CCI) is an oscillator that is often used by forex traders to identify oversold and over bought conditions much in the same way as the RSI or Stochastics.
How it Works The idea behind this indicator is simple, we wait for price to reach an extreme (overbought or oversold) and then trade when price appears to change direction in the hope of catching a move out of the area. Buy signals - The indicator waits for the CCI to become oversold (a value below -100). The indic

Alarm arrow indicator of increased sensitivity After closing the candle the arrows do not disappear Allows you to enter the transaction on time at the lowest price movements Can be used on any currency pairs, metals and cryptocurrency Suitable for working with binary options Distinctive features Does not redraw; Determines the price correction; Advanced settings for fine tuning; Works on all timeframes and on all symbols; Suitable for trading currencies, metals, options and cryptocurrency (Bitco

A classic indicator with advanced features for more accurate display of the market situation. All settings of all moving averages are available, such as the moving average type and the priced used in its calculation. It is also possible to change the appearance of the indicator - line or histogram. Additional parameters provide the ability of fine tuning.
Distinctive features Does not redraw. Additional parameters for fine tuning. Displayed as a line or as a histogram. Works on all timeframes a

Power Index Fx is a new generation indicator that allows an intelligent multi Timeframe analysis. The indicator is flexible and completely customizable. Its positioning in separate window makes it unobtrusive and extremely functional. Its formula of calculation makes it a fundamental tool for identifying possible moments of continuation in favor of Trend. Power Index Fx is a professional tool able to increase your operational potential.
Input Values DASHBOARD SETTINGS How many symbols to show 2

Displays multiple indicators, across multiple timeframes and symbols to give a comprehensive overview of the market. Uniquely, the indicators are configurable and can include custom indicators, even those where you just have the ex4 file or those purchased from Market. Standard indicators can also be selected, the default being ADX, CCI, market price above/below Moving Average (MA), Moving Average Cross (MAX), MACD, Momentum (MOM), OsMA, RSI, Parabolic SAR, William's Percentage Range (WPR). Use

FX Master Expert Advisor opens positions at breakthroughs of support and resistance levels.
The EA trades during both trend and flat movements with no need to adjust parameters.
The EA uses the minimum stop loss (250 points) allowing the efficient use of funds and risk management.
Working timeframe: 1H
Recomended params for trading - all default values, excluding Filtration: AUDUSD=8, EURUSD, GBPUSD, USDCAD =12, USDCHF = 28
Note! Use "Every tick" mode when testing the EA!
Inputs Fix_Lot
The MetaTrader Market offers a convenient and secure venue to buy applications for the MetaTrader platform. Download free demo versions of Expert Advisors and indicators right from your terminal for testing in the Strategy Tester.
Test applications in different modes to monitor the performance and make a payment for the product you want using the MQL5.community Payment System.
You are missing trading opportunities:
- Free trading apps
- Over 8,000 signals for copying
- Economic news for exploring financial markets
Registration
Log in
If you do not have an account, please register
Allow the use of cookies to log in to the MQL5.com website.
Please enable the necessary setting in your browser, otherwise you will not be able to log in.