Watch the Market tutorial videos on YouTube
How to buy а trading robot or an indicator
Run your EA on
virtual hosting
virtual hosting
Test аn indicator/trading robot before buying
Want to earn in the Market?
How to present a product for a sell-through
Technical Indicators for MetaTrader 4 - 106
YOU CAN ONLY FOWARD TEST THIS INDICATOR. USE DEMO FOR THIS AND SHARE YOUR RESULTS This indicator is a combination of different strategies that in theory drive the market. Multi-Currency - Using the separate currencies; Euro and Dollar. RSI - from the separate currencies I get two different RSI values that are used to measure the market strength and direction It is important to note that this is not the Holy Grail and you should use a good money management system.
Two signals will appear from
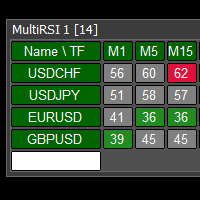
This tool monitors RSI indicators on all time frames in the selected markets. Displays a table with signals to open a BUY trade (green) or SELL trade (red). You can set the conditions for the signal. You can easily add or delete market names / symbols. If the conditions for opening a trade on multiple time frames are met, you can be notified by e-mail or phone message (according to the settings in MT4 menu Tools - Options…) You can also set the conditions for sending notifications. The list of s
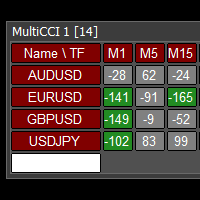
This tool monitors CCI indicators on all time frames in the selected markets. Displays a table with signals to open a BUY trade (green) or SELL trade (red). You can set the conditions for the signal. You can easily add or delete market names / symbols. If the conditions for opening a trade on multiple time frames are met, you can be notified by e-mail or phone message (according to the settings in MT4 menu Tools - Options…) You can also set the conditions for sending notifications. The list of s
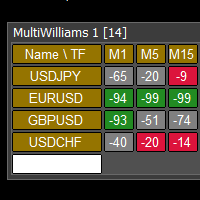
This tool monitors WilliamsPR indicators on all time frames in the selected markets. Displays a table with signals to open a BUY trade (green) or SELL trade (red). You can set the conditions for the signal. You can easily add or delete market names / symbols. If the conditions for opening a trade on multiple time frames are met, you can be notified by e-mail or phone message (according to the settings in MT4 menu Tools - Options…) You can also set the conditions for sending notifications. The li

This indicator Matic indicator.Indicator displays trend movement. Indicator helps to buy and sell. The indicator shows the movement of sak1 and sak2 Stddevchannel, Regression. Features HLper - displays indicator iHighest and iLowest period. ExtDepth - displays indicator ExtDepth. ExtDeviation - displays indicator ExtDeviation. ExtBackstep - displays indicator ExtBackstep. zak1_ST_RE - displays indicator zak1,Stddevchannel,Regression.(true,false) zak2_ST_RE - displays indicator zak2,Stddevchannel

Currency Strength Gauge incicator
The currency strength gauge is an indicator to measure of the strength or weakness of currencies in the Forex market. Comparing the strength of currencies in a graphic representation will lead to a good overview of the market and its future trends. You will see in a graphic chart both the strength of the currencies and their correlation, and this will help you in your decisions to get better trades. -To easy detection of over Overbought and Oversold point

The Katana indicator works like a charm with our other indicator called Trend Forecasting . When you have these 2 indicators, you can use an extraordinary strategy that we provide to you after purchase. Katana is a follow the trend indicator that sends you buy & alert signals. There is several possibilities on how you can use it. 1st Possibility: When market goes above middle line, it's a buy signal. When market goes below middle line, it's a sell signal. You can use it everyday for your ma
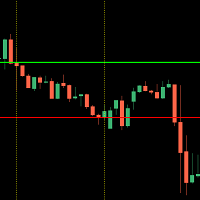
This indicator shows you the higher high and lower low of a certain period of time.
It is easy to use - select your desired time frame (current, 15Min, 1H, 1D) and the corresponding number of candles.
The indicator measures the highest and lowest point within the specified range and automatically draws the two corresponding lines.
The design of the lines is up to you!
Should the trend break one of the drawn lines with a closed candle, a message will be sent to you by the built-in alarm f

This indicator Matic Pro indicator.Indicator displays trend movement. Indicator helps to buy and sell. The indicator shows the movement of sak1 and sak2 Stddevchannel, Regression + zak2 indicator. Features HLper - displays indicator iHighest and iLowest period. ExtDepth - displays indicator ExtDepth. ExtDeviation - displays indicator ExtDeviation. ExtBackstep - displays indicator ExtBackstep. p - line indicator bars back.(bars back= zak2)
m - regression.(1-8),the best(2-3)
i0 -line indicator b

Completely finished trading system. The indicator shows signals for scalping. You can see arrows on the chart when you need to open orders and in which direction. If the arrow is blue, buy. If the arrow is red, sell. The indicator near the zero ara shows potential profit / loss. This information is calculated using the formula (Open [i] -previous_price) / Point.
The indicator does not redraw its values. Almost does not overburden, which gives good information about a change in the direction o

Looking for a quality pivot point indicator? So Prosecution is what you need! To identify pivot points, the Prosecution indicator analyzes many conditions, as the aggregate analysis provides a more accurate picture of the market situation.
What are pivot points? Pivot point analysis is often used in conjunction with the calculation of support and resistance levels, as is the case with trend line analysis. When analyzing pivot points, the first support and resistance levels are calculated usin

The Control indicator is used in the Forex markets. One of the main definitions for monitoring the currency market is a trend that is why the Control indicator was created in order to display the trend in a visual form. You should use the indicator as an additional one, that is, you need to use this indicator, for example, for the perfect display of price movements!
Control is a trend indicator, a technical analysis tool that helps to determine the exact direction of the trend: either the upw

The Avengers trend indicator is used to determine the strength and direction of a trend and to find price reversal points. The indicator is used in the forex markets. Created to visualize the trend. One of the main definitions for monitoring the currency market is trend. Flexible settings of the Avengers trend indicator allow you to receive more accurate signals for opening positions.
The trend can be ascending (bullish trend) and decreasing (bearish trend). In most cases, the trend grows for

Tired of adjusting the indicator settings, wasting precious time? Tired of the lack of confidence in their optimality? Frightened by the unknown in their profitability? Shawshank - Unique indicator for identifying trends. The new system adapts to the market, eliminates additional conditions and copes with its task. A revolutionary new way to identify the start of a trend early. The Shawshank indicator is just for you. It will save you a lot of time that can be spent on more useful activities, fo

Towers - Trend indicator, shows signals, can be used with optimal risk ratio. It uses reliable algorithms in its calculations. Shows favorable moments for entering the market with arrows, that is, using the indicator is quite simple. It combines several filters to display market entry arrows on the chart. Given this circumstance, a speculator can study the history of the instrument's signals and evaluate its effectiveness. As you can see, trading with such an indicator is easy. I waited for an a

Klaus is an arrow indicator for identifying potential entry points. I like it, first of all, because it has a simple mechanism of work, adaptation to all time periods and trading tactics. Suitable for trading on small timeframes because it ignores sudden price spikes or corrections in price movement by reducing market noise around the average price. Forex indicator Klaus is a real trading strategy with which you can achieve the desired results. As soon as the Klaus indicator is installed, the m

The Private indicator displays information in a visual form. You can trade in any currencies, because the strategy is universal and shows entry signals, relying on price patterns. It smooths out price fluctuations when generating a signal by averaging the data and the signal only at certain moments! In those moments when you need to make a decision to enter a position and give the trader a direction. The indicator can work both for entry points and as a filter. The indicator gives the trader th
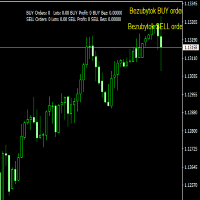
The Breakeven indicator is based on determining the breakeven levels of orders for a given instrument.
The indicator draws the breakeven level of BUY orders, the breakeven level of SELL orders.
If the number of lots between BUY orders and SELL orders between each other, the indicator draws the ALL breakeven level.
Drawing of levels is disabled in the indicator menu.

VWAP Bands gives you the regular Volume-Weighted Average Price and also the deviation bands.
Use this indicator to see the possible amount of market movement, find support and resistance lines, find good spots for entry and exit, and the most important feature is to find possible pivot points.
This indicator has been mathematically improved by Rira team. The calculation begins at the start of each trading day
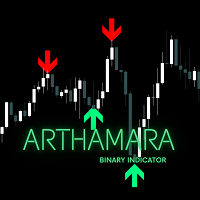
This indicator allows you to trade binary options . based on Bollinger bands and advanced technical analysis, this indicator is 100% NO REPAINT. This indicator is specifically for manual trading Timeframe : M5 / M15 or Higher Expired Time : 1 Candle Pair : Any Arrow Type : Current bar Alert : Current bar / Close Bar INDICATOR PARAMETER BBands Period ( Custom BBands Indicator) BBands Price BBands Deviation Signal Filter ( Level 1 - 3 ) you can use Supply n demand zone , SnR indicator , Auto

Price reach indicator. It also serves as the perfect term for supports and resistance. I use it in two experts. The basic tool for professional trading. The indicator analyzes the last 500 bar and uses this to determine the levels ( but it doesn't predict the future ) . Personally, I use it on TF H1. It is very simple. Four lines on chart and that's all. Only two input parameters. Thousands of indicators. Why this? Is good ? No! Is very good. Please test the indicator prior to purchasing.
Magic Levels for MT4 by Jeanne Soft The Magic Levels indicator was created to solve three important tasks of successful trading: 1) construction of the nearest support and resistance levels for the selected timeframe, 2) timely identification of situations when the instrument is overbought or oversold, 3) indication of the probable trend reversal points. The indicator allows you to significantly save time analyzing the current situation on the selected instrument and contributes to making the ri
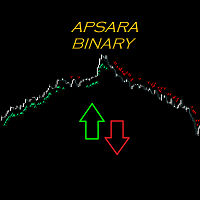
This indicator allows you to trade binary options and specially programmed to get the momentum to follow the trend that is happening in the live market. This indicator is based on trend strength, price correction and advanced technical analysis,this is 100% NO REPAINT. This indicators specifically for manual trading, I suggest using a platform that uses an expiration time Timeframe : M1 or M5 Expired Time : 1 Candle Pair : Any ( even better in the CAD market ) Time Session : Europe and NewY
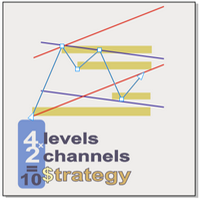
Supply and demand In all indicators that have the task of drawing support and resistance, the number of levels is so high that it causes a trader to make a mistake. We draw the last 4 important and valid levels for you using the Price Action method These surfaces are not easily broken and their breaking is done with long and powerful candlesticks Sometimes traders draw levels and wait for the price to reach those levels, but new levels may be created between the previous two levels in the f

Brief description The ContiStat indicator calculate statistic frequency of green (up) and red (down) movement in the chart and determine movement dynamics (silver curve). There are two key parameters to understand the ContiStat principle: Block height and Block count . The ContiStat engine convert instrument price chart move to Blocks of constant height (price) regardles of how much time it take. Example 1: Block height is set to 50. DE30 index price make move from 15230 to 15443 in an hour. 4 g

Pro Trend Signal System indicator is designed for trend and signal trading. This indicator generates trend signals. It uses many algorithms and indicators to generate this signal. It tries to generate a signal from the points with the highest trend potential. This indicator is a complete trading product. This indicator does not need any additional indicators. You can only trade with this indicator. The generated signals are displayed on the graphical screen. Thanks to the alert features you

This indicator Super Neuro Trend indicator.Indicator displays trend movement. Indicator helps to buy and sell. Features FiltPer- displays indicator period. deviation - displaus indicator deviation. Trend - displaus indicator trend.( true,false) Rectangle - displaus indicator rectangle. (true,false)
How to understand the status: If the trend color is green, trend is up. I f the trend color is red, trend is down. I f the trend waiting,trend waiting.
/////////////////////////////////////////
The indicator shows entry points taking into account the trend, has flexible settings for filtering and aggressiveness of signals. The trend is set using four configurable movings with a rising period. Signals are filtered at the best price to enter. There are switches for this. The indicator does not redraw signals on history, gives sound signals and supports sending messages to mail and Push messages to mobile devices.
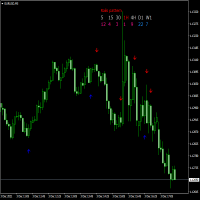
The RAILS indicator is the identification of the candlestick analysis pattern - Price Action. It signals an imminent price reversal or pullback. The main feature is the identification of candle combinations. In this case, the indicator is looking for two adjacent candles that are directed in different directions. In the upper part there is an information panel where information about different timeframes and identified "Rails" paptterns. There is also information - how many bars to that the pat
The indicator may be of interest to traders who use Fibonacci and Gann levels in their trading. The construction of levels is set by the range of the previous day. It is possible to set colors and styles of all lines in the indicator. It is possible to switch the view mode using buttons on the chart. The indicator practically does not load the terminal as it is recalculated either on a new bar or when switching buttons.
The indicator calculates the probability of a price reversal for a given size of price movement based on historical data. Made in a multicurrency version. When the price reversal probability specified in the properties is reached, the indicator emits a sound signal. It can display a table of the probability of reversals for several specified price movements for all instruments. Has the function of recording statistics of historical data in a CSV file, for viewing in Excel.

TrendControl is an arrow indicator of technical analysis for determining a trend, which can adjust to the price, is a graphical plot calculated using mathematical formulas, the initial data for which is a price chart. The indicator shows the direction of the trend, takes into account the minimum and maximum values of the extreme candles on the chart, then brings them to the average and compares them with the past data.
The principle of operation of the indicator is to automatically determin

The MyEwo indicator is a tool that helps you to find the short maturity direction in your chart. Default input values are frequently used values in this indicator. You can find and use your own values according to your own trend detection and pairs you will trade.
My advice is to use a moving average in order to understand the long maturity trend on your main graph (200 and higher may be appropriate). The M5 graphics will be simplify Scalping style Trade transactions that you will use . You can
Nobilis AI. Интеллектуальная торговая система.
это готовая торговая система для работы на любом инструменте и любом таймфрейме.
Полностью готова для ручной торговли и использовании в роботах Канал не перерисовывается Сигналы не перерисовываются Интеллектуальный расчет сигналов под каждый инструмент и таймфрейм Рассчитывает и показывает торговые позиции Подбирает наилучшие торговые параметры 10000 активаций
Удобно работать на всех таймфреймах от M1 до W1.
Протестировано на металлах, валю

SF TREND SIGNAL - уникальный индикатор использующий несколько входных данных для определения тенденции, и сигнала для входа в сделку, в ее направлении. Подходит для любой валютной пары, любого таймфрейма, и не меняет свои показания. Индикатор очень прост в настройке, что является хорошим преимуществом для исследований.
Параметры индикатора Основные настройки ( Main Settings ): SlowPeriod - период для расчета тенденции. FastPeriod - период для расчета сигнала. SlowSmooth - сглаживание значен

VictoryTMA (Triangular Moving Average) is a channel indicator without redrawing, built on the basis of moving averages. The key difference of the VictoryTMA indicator from other channel indicators (for example, from the same Bollinger) is that VictoryTMA does not take into account simple moving averages, but twice smoothed, which, on the one hand, allows you to more clearly determine the market movement, but the other hand, makes the indicator less sensitive.

Alan Hull's moving average, more sensitive to the current price activity than the normal MA. Reacts to the trend changes faster, displays the price movement more clearly. My HMA indicator is the developed state of the standard HMA indicator. The indicator is Non Repaint Version. The indicator shown in a separate window is worth the value of -1 to 1. Default entries will give better results in the M15 chart for the parities. With different entry values, you can also get better results in differen

This indicator Mega Super Neuro Trend indicator.Indicator displays trend movement. Indicator helps to buy and sell.Trend1= line1 > < line1,trend2=line1 > < line2,trend3 = line1,line2 > < line3. Features Trend - displaus indicator trend.( true,false)
How to understand the status: If the trend color is green, trend is up. I f the trend color is red, trend is down.
////////////////////////////////////////////////////////////////////////////////////////////////////////////////////////////////
53% OFF until December 31 (Normal price $125)! Don't miss the opportunity to have this invaluable tool! This is a totally automated multi timeframe support and resistance levels finder on every MT4 chart. No manual work! Just drop this indicator on a chart and you will have the S/R levels always up to date. It is very convenient and helps the trader to anticipate possible stalls and reversions in price movements. The levels are displayed as lines and each timeframe has a different color.
The
According to the law of nature which states that everything is a vibration, I have built this measurement model and which detects the best frequencies in the movement of the price, so just adjust the frequency in the input parameter of the candlestick watcher how are they arranged on the level lines (support/resistance). Lists of good frequencies : 236, 369,417,528, 618,741,963,1236,1484.
You can also search for the frequency that suits your asset! just use the parameter: frequency

Alpha Signal - индикатор предназначенный для поиска локальных экстремумов, определения текущей тенденции. В расчетах индикатора используется авторская методика. С помощью индикатора можно определять места возможного разворота цены желательно в направлении тенденции, но также с достаточной точностью и против нее. Также с помощью индикатора можно определять текущую тенденцию. Индикатор подходит для любых валютных пар, но для адекватного отображения показания необходимо, чтобы было достаточно ист

Beta Signal - индикатор предназначенный для поиска локальных экстремумов, определения текущей тенденции. В расчетах индикатора используется авторская методика. С помощью индикатора можно определять места возможного разворота цены желательно в направлении тенденции, но также с достаточной точностью и против нее. Также с помощью индикатора можно определять текущую тенденцию. Индикатор подходит для любых валютных пар, но для адекватного отображения показания необходимо, чтобы было достаточно исто
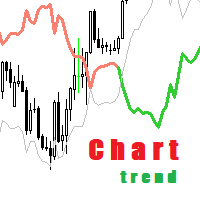
Определения текущей тенденции одна из самых важных задач трейдера не зависимо от стиля торговли. Индикатор Chart Trend поможет с достаточно высокой вероятностью это сделать. Chart Trend - индикатор распознавания тенденции, использующий авторский алгоритм расчета. Индикатор подходит для любой валютной пары, любого таймфрейма, и не меняет свои показания.
Параметры индикатора Основные настройки ( Main Settings ): HistoryBars - количество баров для отображения. CalcMode - выбор метода р

Определения текущей тенденции одна из самых важных задач трейдера не зависимо от стиля торговли. Индикатор Good Ribbon поможет с достаточно высокой вероятностью это сделать.
Good Ribbon - авторский индикатор основан на усреднении ценовых значений по уникальной методике. Индикатор подходит для любой валютной пары, любого таймфрейма, и не меняет свои показания.
Параметры индикатора Основные настройки ( Main Settings ): HistoryBars - количество баров для отображения. IndicatorID - иден

Strength Dashboard is an advanced and easy to use MT4 dashboard indicator that detects and shows latest strength percentage of each currency during all 28 pairs. It's very good for trend detection and scalping trade even when the market is flat and range ,it shows each pairs which need to open order in certain direction ,when there is up trend that pair will be in Green color for buy signal and vice versa for sell signal is in Red color and then the color is in Grey ,means the market is neutral/

Pro Price Trading indicator is designed for trend and signal trading. This indicator generates trend signals. It uses many algorithms and indicators to generate this signal. It tries to generate a signal from the points with the highest trend potential. This indicator is a complete trading product. This indicator does not need any additional indicators. You can only trade with this indicator. The generated signals are displayed on the graphical screen. Thanks to the alert features you can g

Hi, You can find the perfect buy sell signal with this indicator including trend line. This indicator providing signal based on some calculation of multiple moving averages. it gives arrow for buy and sell signal with color change in trend line. all the colors can be customize. For exit point you can use RSI indicator(14) along with this. I am attaching image for for your reference. Best Pair for this indicator :- EURUSD , USDCHF. Basic details of entry and exit :- Buy Entry :- Enter in the mark
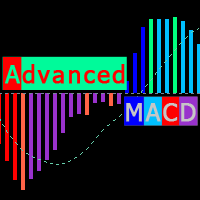
Modified MACD, for technical analysis of charts, with color backlight of histogram signals. The indicator highlights, the direction of the histogram movement, the change in the direction of the histogram movement, the histogram peaks, the interaction of the histogram and the signal curve. Also, the indicator makes it easier to find convergences / divergences between bars and the histogram (which serve as a powerful signal in some trading systems using the MACD indicator). Color designation of Ad

Forex indicator is a trading system that shows the trader in the form of a line on the chart the direction of price movement. The red line indicates the downward trend movement and the blue line indicates the uptrend movement. This indicator is suitable for trading with a scalping system. When the line is blue and the price is below the line, we buy. Close the order when the price rises above the line. When the line is red and the price is above the line, we sell. We close the deal when the pri

The Omega Trend Oscillator is a trend indicator based on Moving averages and Bollinger bands. I made it simple for you to have easy and soft market analysis approach.
The indicator can be used for the following purpose. 1. For trend analysis 2. For determining the overbought and oversold market condition 3. For discovering market selling and buying opportunities.
Meaning of colors on the indicator FOR BULLISH MARKET (Buy) 1. Lime color is for bullish market/trend 2. Blue color is for very
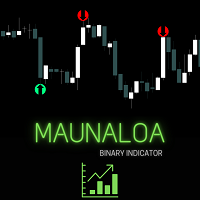
Mauna loa is an indicator for binary options, programmed to get momentum reversal and recommended for manual trading Indicator Parameter Alert = true/false AlertOnBar = Current Bar / Close Bar RSI Period = RSI Period Slowed UPDown Movement = Used to slow the up and down movement of the RSI indicator Smooth RSI Line = Used to smooth RSI lines OverBought Level = RSI Overbought OverSold Level = RSI Oversold Signal Filter = On/Off Filter Based On = RSI Indicator / Price HILO / Extreme level OBO
This indicator is intended for both beginners and more experienced traders. The indicator is based on the price channel, which shows the direction of price movement: up (BUY), flat (sideways movement), down (SELL). The channel does not roll over when the price is corrected, but corrects with it. The indicator arrows show price fluctuations in the market and are not redrawn. The ExtrLineLenght lines can be increased to determine the nearest supports and resistances. The indicator is simple and ea

The price channel is a trader's main tool for analyzing the current market situation. With its help, you can successfully predict the future price behavior, but the main factor in making a profit is timely decisions. This is often a problem, because it is simply impossible to constantly look at the monitor.
This indicator builds and updates automatically two trend channels with different periods (fast and slow). The trend is determined using linear regression. It is also possible to use 1 cus

This Scanner will help you to get Pivot points , Resistance and Support Points on the Symbols in your watchlist, using this and the best part is it give alert in all format whether its a e-mail, or Phone Notification alert, or Pop-up Alerts. There are multiple points as : 1) Standard Pivot Points 2) Fibonacci Pivot points 3) Camarilla Pivot points 4) Woddie Pivot points. 5) Bollinger Bands.
Type of Alerts are : 1) Cross Alert. 2) Near_Alert. 3) Cross and Bounce Alert. 4) Bounce only Alert.
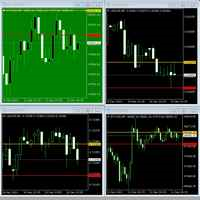
Especially if you watch a lot of charts at once, you can easily miss the start of the price movement. This indicator helps you change the color of the chart if depending on whether the exchange rate is within a range or leaving it. Just imagine: you have 30 black charts, 1 of which turns green, for example. You must notice!
Usage: Drag the indicator to the chart, set the desired background colors, define the desired band by setting the "down" and "up" lines. Ready!
Follow me. I post new stu
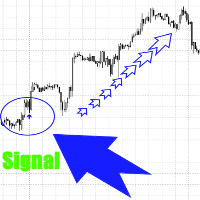
Данный индикатор не перерисовывает сигналы и это значит , что там, где он нарисует стрелку там она и останется. Сигналы рисуются здесь и сейчас, а не спустя время , когда цена прошла уже далеко.
Индикатор отлично подойдёт для трендового рынка.
Индикатор является помощником в торговле, он даёт сигнал на покупку или продажу, а вы принимаете решение использовать рекомендации индикатора или нет.
Цена на индикатор минимальна и может вырасти в любое время.
Работает на любых инструментах,т

1. What is this Rising volatility and falling volatility are not the same, whether it is academic research or actual testing has shown this point. The original ATR indicator is calculated by putting up and down fluctuations together. This indicator is to calculate separately the upward volatility and the downward volatility, which can better help you study the market.
2. Indicator description There are two modes for the calculation of this indicator, as shown in the f
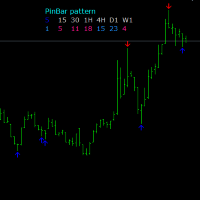
One of the Price Action patterns called PinBar is implemented in a custom indicator. Usually means a large candle with a small body and a large tail. Such candles appear at the end of a movement or candles that indicate a continuation of the trend. The peculiarity of this PinBar indicator is that it determines the pattern on all timeframes. Information output by arrows is organized for the active timeframe and additionally for timeframes H1, H4, D1.
Unlike a standard moving average, trendy traders unique algorithm will show you a less choppy signal resulting in a smoother and easier trend to follow thereby making your trading decisions more confident. Put simply when price moves above the average it signals a bullish trend and when price moves below the average it signals a bearish trend. The trader is then given 2 levels of take profit and a stop loss on each new signal. It can also be added to other trend-following systems for better per

Bonsosu attack is Binary indicator for binary option trade highly winrate and highly return ........... Design for full auto trade with bot or connetor from MT4 to Binary Broker ...____ Easy to use, No repaint,,, ___ Time frame M1 only, ..... ___ Work with 28 forex pair without martingale, ....__ Support all binary broker, .... Trading with experation .....

Bonsosu P is Binary indicator for binary option trade highly winrate and highly return ........... Design for full auto trade with bot or connetor from MT4 to Binary Broker ...____ Easy to use, No repaint,,, ___ Time frame M1 only, ..... ___ Work with 28 forex pair without martingale, ....__ Support all binary broker, ....__ Trading with experation ..... __

Bonsosu Toon is Binary indicator for binary option trade highly winrate and highly return ........... Design for full auto trade with bot or connetor from MT4 to Binary Broker ...____ Easy to use, No repaint,,, ___ Time frame M1 only, ..... ___ Work with 28 forex pair without martingale, ....__ Support all binary broker, ...._ Trading with experation .....

Bonsosu Magic is Binary indicator for binary option trade highly winrate and highly return ........... Design for full auto trade with bot or connetor from MT4 to Binary Broker ...____ Easy to use, No repaint,,, ___ Time frame M1 only, ..... ___ Work with 28 forex pair without martingale, ....__ Support all binary broker, ...._ Trading with experation .....

Stochastic Cross Arrow is an indicator that automatically places arrow when stochastic K and D line crosses each other on a certain level.
Buffer Guide For Developers: Buffer 0 =Buy Arrow Buffer 1 =Sell Arrow Inputs: ---Stochastic Settings--- %K - %K value. %D - %D value. Slowing - Slowing value . Stochistic Method - Moving Average method. It can be any of enumeration values. Newbar - arrow only appear on new bar. Buy_Msgs - type info message when buy arrow appears. Sell Msgs - type inf

This indicator recognizes all support and resistance levels. A number of unique high-performance techniques have been applied, which made the existence of this indicator possible.
All formed channels are naturally visible: horizontal linear linear parabolic cubic (Polynomial 3 degrees - Wave) This is due to a bundle of approximating channels. The formed channels form "standing waves" in a hierarchical sequence. Thus, all support and resistance levels are visible.
All parameter management is
Price Action Indicator MT4 calculates the buying/selling force level balance of any symbol/instrument, based on pure price action data of the specified (8 by default) past candles. This will give you the closest market sentiment possible by monitoring the price action of 32 symbols/instruments that are available on the indicator's panel. A buying/selling force level over 60% gives a quite solid level for buy/sell the specific symbol (using the default settings). Price Action Indicator MT4 has
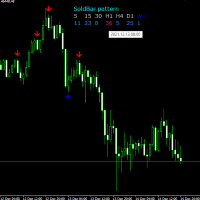
The Soldbar indicator is a price action candlestick pattern indicator. It indicates the begin or end of a trend. The information panel shows the last Soldbar of the found pattern on all time frames. When you hover the mouse arrow over an information bar, the pop-up menu shows the time of that bar. The signal of the active window is displayed by arrows, it is separately possible to turn on additional information timeframes H1, H4, D1.

The Before indicator predicts the most likely short-term price movement based on complex mathematical calculations.
Most of the standard indicators commonly used in trading strategies are based on fairly simple calculations. This does not mean that there were no outstanding mathematicians in the world at the time of their creation. It is just that computers did not yet exist in those days, or their power was not enough for the sequential implementation of complex mathematical operations. Nowa
The indicator creates a subwindow with the chart of the symbol selected in the settings.
Currency pair
Shows the high and low levels of the specified number of bars.
Period resistance & support
Resizable available
Width resistance & support
Available history limitation for display
Month limiting history / false-all available
Color customization available
Bullish candle & resistance color
Bearish candle & support color
Bars & Bid line color
Displays pop-up

This indicator builds a projection of the higher timeframe on the current timeframe. Visualization in the form of candles. Helps to better understand the processes within the market and its scale. Makes it easier to find candlestick patterns. It is possible to enable several indicators with different parameters and see many timeframes at the same time. In the settings, you can change the color of the candles in each direction and their thickness. Important! If the indicator does not draw anyth
The MetaTrader Market is a simple and convenient site where developers can sell their trading applications.
We will help you post your product and explain you how to prepare your product description for the Market. All applications on the Market are encryption-protected and can only be run on a buyer's computer. Illegal copying is impossible.
You are missing trading opportunities:
- Free trading apps
- Over 8,000 signals for copying
- Economic news for exploring financial markets
Registration
Log in
If you do not have an account, please register
Allow the use of cookies to log in to the MQL5.com website.
Please enable the necessary setting in your browser, otherwise you will not be able to log in.