Watch how to order a trading robot
Read the Rules before you post an order or execute it
How to Order a Trading Robot in MQL5 and MQL4
See a sample Requirements Specification to order a robot
New orders in the category:
100 - 250 USD
100 - 200 USD
30+ USD
45 - 205 USD
30+ USD
60+ USD
Job finished
Execution time 49 days
Feedback from customer
best developer so far
Feedback from employee
Thank you!
Specification
This Expert Advisor (EA) is designed to operate on the XAUUSDm symbol (Gold micro), using the 1-minute timeframe as the main chart and the 5-minute timeframe as the higher timeframe.
It is built to follow the logic of the “Supertrend MTF Heikin Ashi Auto” indicator from TradingView, exactly as shown in the reference screenshot.
The EA must fully comply with all detection, validation, and execution conditions explained below.
The Expert Advisor will be accepted only if it perfectly replicates the trades generated by the TradingView indicator "Supertrend MTF Heikin Ashi Auto" on the symbol XAUUSDm (Exness account), using the 1-minute chart for entries and the 5-minute chart for higher timeframe confirmation, during the full period from 15 March 2025 to 22 April 2025. It must detect the exact same Signal Candles, correctly wait for and confirm pullbacks, and execute trades precisely at the next candle open (Ask price for Buy, Bid price for Sell). Stop Loss must match the value of the 1-minute Supertrend at the Signal Candle, and all trades must include a trailing stop loss calculated as a percentage of the original SL. All entry and exit prices must be identical to those produced by the TradingView strategy—any deviation, missed trade, or incorrect execution will result in the EA being rejected.
The EA includes user options to:
Trade Buy signals only
Trade Sell signals only
Trade both Buy and Sell signals
It also includes a Trailing Stop Loss system based on the original Stop Loss, which dynamically protects profits once the trade moves in a favorable direction.
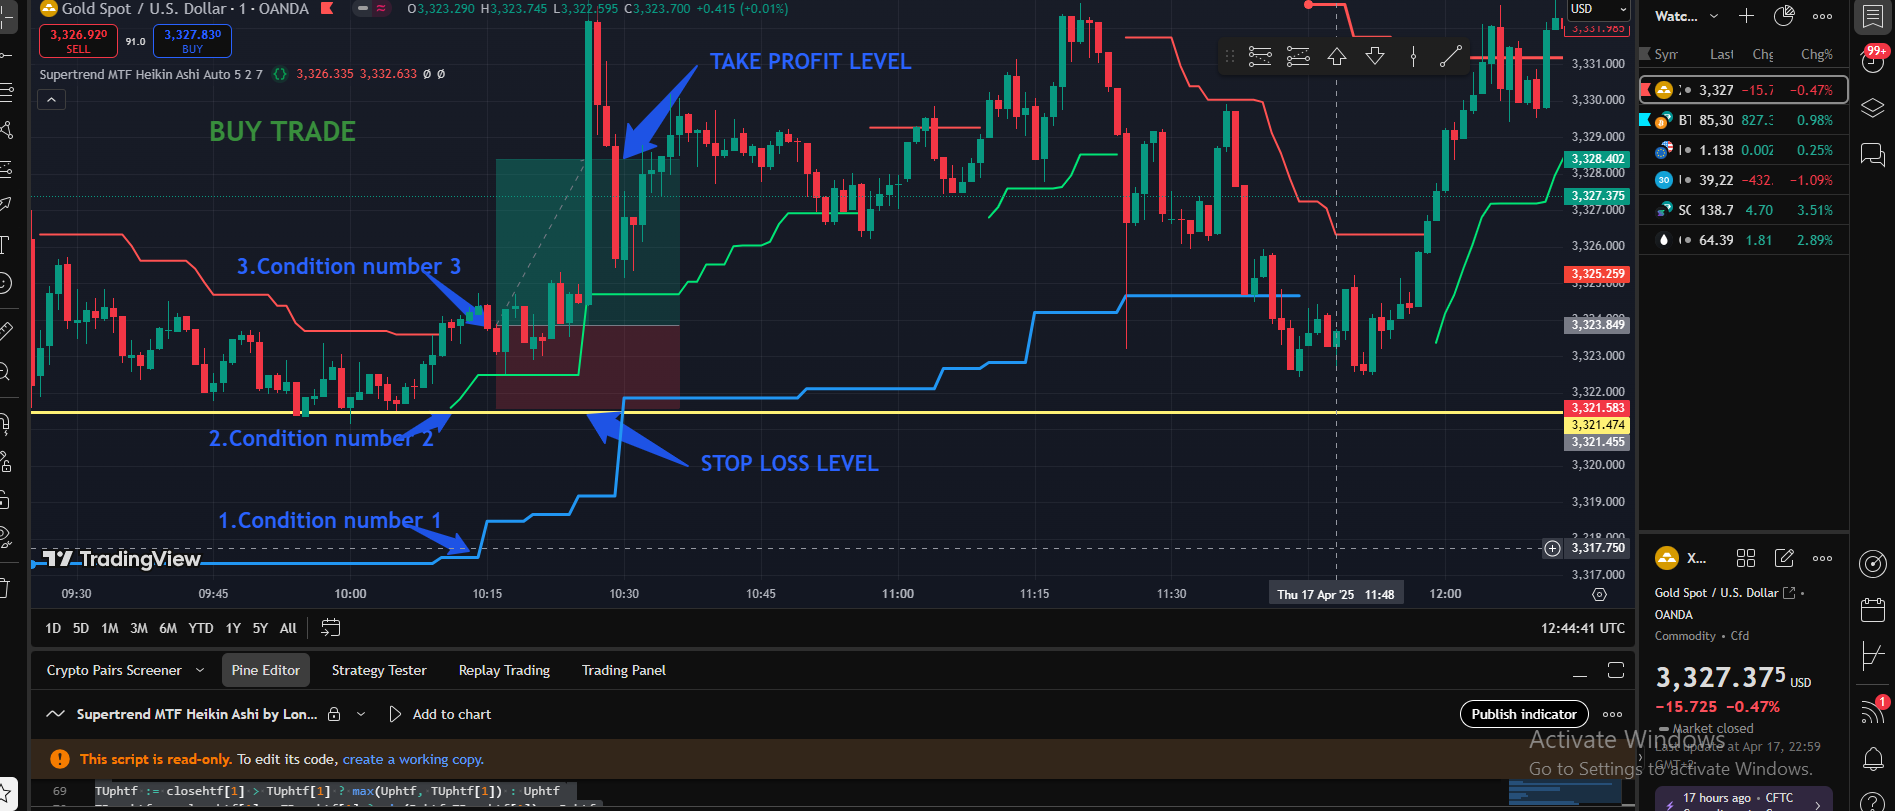
🔷 Buy Trade Setup
✅ Step 1 – Detect the Signal Candle
Monitor each new candle as it closes.
You are looking for the first candle where both of the following conditions are met :
The higher timeframe Supertrend turns bullish (a blue line appears below the same candle).
The current timeframe Supertrend also turns bullish (a green line appears below the candle).
When both conditions are met, that candle becomes the "Signal Candle."
✅ Step 2 – Record Key Values from the Signal Candle
Once the Signal Candle is identified:
Signal Close Price:
This is the closing price of the Signal Candle.
It will be used later to confirm the pullback condition.
Stop Loss Level:
This is the value of the HTF Supertrend line (blue) at the time the Signal Candle closes.
This line represents the dynamic support calculated from the higher timeframe's Heikin Ashi-based Supertrend.
This value will be used as the Stop Loss for the trade.
📌 Example:
If the HTF Supertrend value at the Signal Candle is 3321.47, that becomes your exact Stop Loss.
✅ Step 3 – Wait for a Pullback
After the Signal Candle is closed, do not enter a trade immediately.
Start monitoring the subsequent normal candles (not Heikin Ashi).
✅ Step 4 – Confirm the Pullback
For each new candle after the Signal Candle:
If a candle closes with a closing price lower than the Signal Close Price, the pullback is confirmed.
This confirms a retracement after the bullish signal.
✅ Step 5 – Execute the Buy Trade
Once the pullback candle closes below the Signal Close Price:
Enter a Buy trade immediately at market on the next candle's open using the market Ask price).
Set the Stop Loss at the HTF Supertrend line value recorded at the Signal Candle.
take profit
A Risk:Reward ratio based on the Stop Loss.
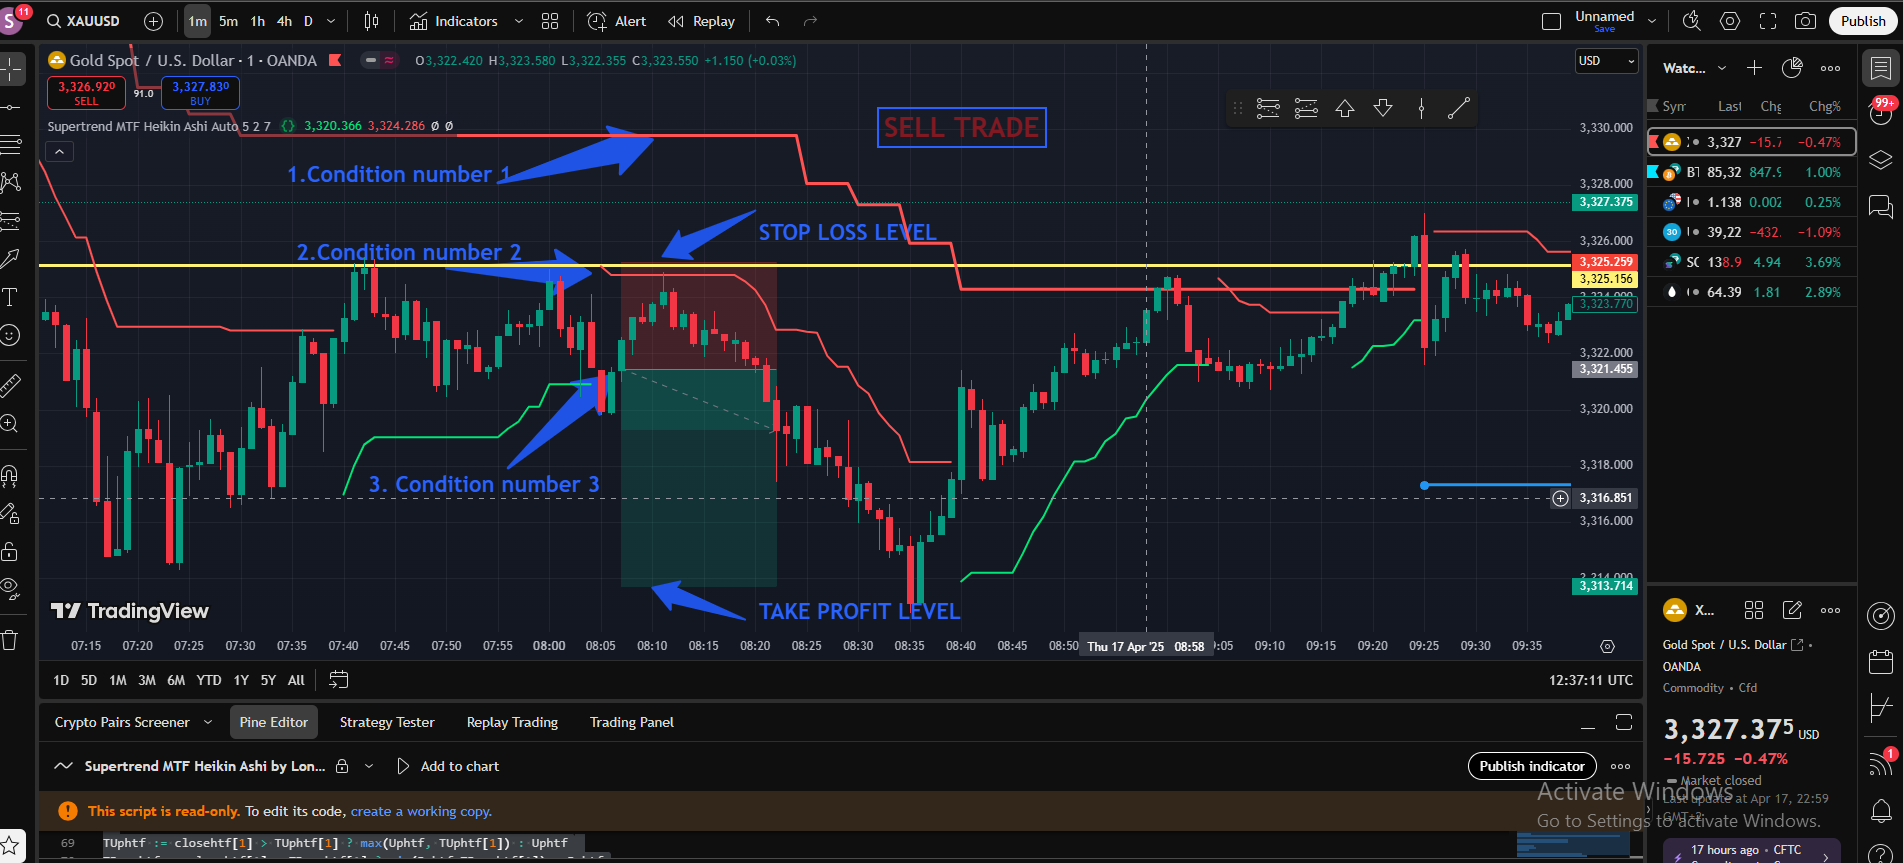
Sell Trade Setup
Step 1 – Detect the Signal Candle
Monitor each new 1-minute candle at close.
Wait for the following:
The 5-minute Supertrend is already bearish (red line above M1 candles).
Sell Trade Setup
Then, a 1-minute candle shows a new red Supertrend line above it (1-minute Supertrend turns bearish).
✅ This candle becomes the Signal Candle.
✅ Step 2 – Record Key Values
Signal Close Price → closing price of the Signal Candle.
Stop Loss → value of the 1-minute Supertrend red line at the Signal Candle close.
📌 Example: If SL = 2346.25, store that value for trade management.
✅ Step 3 – Wait for Pullback
Do not enter the trade immediately.
Watch for a candle that closes above the Signal Close Price.
✅ Step 4 – Confirm Pullback
When a candle closes above the Signal Close Price, it confirms a pullback.
✅ Step 5 – Execute the Sell Trade
Enter a Sell trade at market on the next candle open (Bid price).
Use the previously stored 1-minute Supertrend value as Stop Loss.
✅ Take Profit & Trailing Stop Loss
You must enable a Trailing Stop Loss to manage exits.
🔄 Trailing Stop Loss – Logic:
As price moves in your favor, the stop loss will trail behind price by a fixed distance.
This trailing distance is defined as a percentage of the original Stop Loss.
Supertrend MTF Heikin Ashi source code
@version=4
study("Supertrend MTF Heikin Ashi", overlay = true)
mode =input(title = "HTF Method", defval = 'Auto', options=['Auto', 'User Defined'])
//auto higher time frame
HTFo =timeframe.period == '1' ? '5' :
timeframe.period == '3' ? '15' :
timeframe.period == '5' ? '15' :
timeframe.period == '15' ? '60' :
timeframe.period == '30' ? '120' :
timeframe.period == '45' ? '120' :
timeframe.period == '60' ? '240' :
timeframe.period == '120' ? '240' :
timeframe.period == '180' ? '240' :
timeframe.period == '240' ? 'D' :
timeframe.period == 'D' ? 'W' :
timeframe.period == 'W' ? '5W' :
'D'
HTFm = input('5', title = "Time Frame (if HTF Method=User Defined)", type=input.resolution)
HTF = mode == 'Auto' ? HTFo : HTFm
Mult = input(defval = 2.0, title = "ATR Factor", minval = 0.5, maxval = 100, step = 0.1)
Period = input(defval = 7, title = "ATR Period", minval = 1,maxval = 100)
// current time frame
//Heikin Ashi high, low, close
h = security(heikinashi(syminfo.tickerid), timeframe.period, high)
l = security(heikinashi(syminfo.tickerid), timeframe.period, low)
c = security(heikinashi(syminfo.tickerid), timeframe.period, close)
//HeikinAshi atr
Atr = security(heikinashi(syminfo.tickerid), timeframe.period, atr(Period))
Up = (h + l) / 2 - (Mult * Atr)
Dn = (h + l) / 2 + (Mult * Atr)
float TUp = na
float TDown = na
Trend = 0
TUp := c[1] > TUp[1] ? max(Up,TUp[1]) : Up
TDown := c[1] < TDown[1] ? min(Dn,TDown[1]) : Dn
Trend := c > TDown[1] ? 1: c < TUp[1]? -1: nz(Trend[1],1)
Trailingsl = Trend == 1 ? TUp : TDown
linecolor = Trend == 1 and nz(Trend[1]) == 1 ? color.lime : Trend == -1 and nz(Trend[1]) == -1 ? color.red : na
plot(Trailingsl, color = linecolor , linewidth = 2, title = "SuperTrend")
// Higher Time Frame
////// HTF high, low, close
highhtf = security(heikinashi(syminfo.tickerid), HTF, high[1], lookahead = barmerge.lookahead_on)
lowhtf = security(heikinashi(syminfo.tickerid), HTF, low[1], lookahead = barmerge.lookahead_on)
closehtf = security(heikinashi(syminfo.tickerid), HTF, close[1], lookahead = barmerge.lookahead_on)
// ATR for HTF
HTfatr = security(heikinashi(syminfo.tickerid), HTF, atr(Period)[1], lookahead = barmerge.lookahead_on)
Uphtf = abs(highhtf + lowhtf) / 2 - (Mult * HTfatr)
Dnhtf = abs(highhtf + lowhtf) / 2 + (Mult * HTfatr)
float TUphtf = na
float TDownhtf = na
TrendHtf = 0
TUphtf := closehtf[1] > TUphtf[1] ? max(Uphtf, TUphtf[1]) : Uphtf
TDownhtf := closehtf[1] < TDownhtf[1] ? min(Dnhtf,TDownhtf[1]) : Dnhtf
TrendHtf := closehtf > TDownhtf[1] ? 1 : closehtf < TUphtf[1] ? -1: nz(TrendHtf[1], 1)
TrailingslHtf = TrendHtf == 1 ? TUphtf : TDownhtf
linecolorHtf = TrendHtf == 1 and nz(TrendHtf[1]) == 1 ? color.blue : TrendHtf == -1 and nz(TrendHtf[1]) == -1 ? color.red : na
st = plot(TrailingslHtf, color = linecolorHtf , linewidth = 3, title = "Supertrend HTF")
plot(TrendHtf == 1 and TrendHtf[1] == -1 ? TrailingslHtf : na, title="Supertrend HTF Trend Up", linewidth = 4, color=color.blue, style = plot.style_circles)
plot(TrendHtf == -1 and TrendHtf[1] == 1 ? TrailingslHtf : na, title="Supertrend HTF Trend Down", linewidth = 4, color=color.red, style = plot.style_circles)
//Alerts
alertcondition(Trend == 1 and Trend[1] == -1, title='Supertrend Trend Up', message='Supertrend Trend Up')
alertcondition(Trend == -1 and Trend[1] == 1, title='Supertrend Trend Down', message='Supertrend Trend Down')
alertcondition(TrendHtf == 1 and TrendHtf[1] == -1, title='Supertrend HTF Trend Up', message='Supertrend HTF Trend Upl')
alertcondition(TrendHtf == -1 and TrendHtf[1] == 1, title='Supertrend HTF Trend Down', message='Supertrend HTF Trend Down')
Responded
1
Rating
Projects
0
0%
Arbitration
1
0%
/
100%
Overdue
0
Free
2
Rating
Projects
0
0%
Arbitration
0
Overdue
0
Free
3
Rating
Projects
945
47%
Arbitration
309
58%
/
27%
Overdue
125
13%
Free
4
Rating
Projects
0
0%
Arbitration
0
Overdue
0
Free
Similar orders
Hola, traders e inversores: Desarrollamos soluciones de trading algorítmico para MetaTrader 4 y MetaTrader 5. Creamos bots, indicadores y herramientas a medida que convierten estrategias manuales en sistemas automáticos, configurables y orientados a una gestión de riesgo sólida. Hemos trabajado en automatizaciones que integran entradas y salidas por reglas, cálculo de lotaje, control de drawdown, filtros de horario y
MT5 Expert Advisor
30+ USD
I have developed a custom semi-automated MT5 trading workflow for personal use. I am available to discuss its technical implementation, automation features, and overall workflow with developers or traders interested in similar solutions. The project includes MT5 automation, Telegram communication, trade execution tools, and configurable risk management components. If you are working on a similar project or looking
Bollinger and rRSI
30+ USD
automatic robo sell at bollinger band upwards breach and rsi should above 80 and buy when bollinger breach downwards and rsi is below 30, rsi shoould works only on Gold trade and none ofhe trades
Hello, I need a custom Expert Advisor for MetaTrader 5. I am trading from mobile only. **Account & Style:** - Capital: $5,000 - $10,000 - Risk: Moderate/Balanced - Trading Style: Scalping **Pairs & Timeframe:** - Symbols: EURUSD and XAUUSD - Timeframe: M5 **Strategy:** - BUY: RSI(14) < 30 AND Price > 20 EMA - SELL: RSI(14) > 70 AND Price < 20 EMA - Only 1 trade per symbol at a time - No Martingale / No Grid **Risk
Lokingo for an Expert MT5 Indicator Developer
30 - 300 USD
I am looking for a highly experienced developer to build a professional, commercial-grade trading indicator for MT4/MT5. I am not looking for a basic indicator or a modified public script. I need a custom solution based on real market logic with high-quality coding standards. Requirements 100% Non-Repainting indicator. Accurate Entry signals. Automatic Stop Loss placement based on real market structure. Automatic
I have an MT4 custom indicator (.ex4) that I use regularly, and I would like an identical MT5 version. Important: I do not have the source code (.mq4). I only have the compiled MT4 indicator. I am looking for an experienced MQL developer who can recreate the indicator's functionality and appearance for MT5 by analyzing its behavior. The MT5 version should match the MT4 version as closely as possible, including
Mac200
50+ USD
I need a Trend following Bot. Here we took entries by looking at two indicator which are 200 period ema and 12 26 9 MacD. Rules for entry exit are: Buy trade: When market is above 200 ema and MacD Line cross over the signal line and this cross over happened below the zero line of MacD indicator. We simply put Buy trade. Sell trade: When market is below 200 ema and MacD line crosses below the signal line and this
Iconic Boy
300 - 400 USD
Am looking for a bot to trade .so that I can be able to trade and become very successful and make some profit so that I cannot sleep on a empty stomach
Hello Traders and Investors, I am a professional algorithmic trading developer specialized in building high-quality Expert Advisors (EAs), Indicators, Scripts, and Trade Management Tools for MetaTrader 4 and MetaTrader 5. With extensive experience in financial markets and trading automation, I can transform your trading ideas into reliable and efficient solutions with clean, optimized, and well-structured code. My
Hello, I’m a profitable MT4/MT5 trader specializing in Prop Firm accounts. What makes me different: I actually trade with 3% Daily DD / 5% Overall DD rules, so I know what blows accounts and what passes. Services I offer: 1. EA Backtesting + Detailed Reports - Winrate, Profit Factor, Max DD, Best Pairs/Timeframes 2. Strategy Documentation - I’ll write clear rules for your EA so any coder can build it 3. Prop Firm
Project information
Budget
60+ USD
Deadline
to 15 day(s)