Watch how to order a trading robot
Read the Rules before you post an order or execute it
How to Order a Trading Robot in MQL5 and MQL4
See a sample Requirements Specification to order a robot
New orders in the category:
50 - 200 USD
30+ USD
Job finished
Execution time 5 days
Feedback from customer
Thank you for a quick and efficient solution to my request..
Feedback from employee
Very nice person
Specification
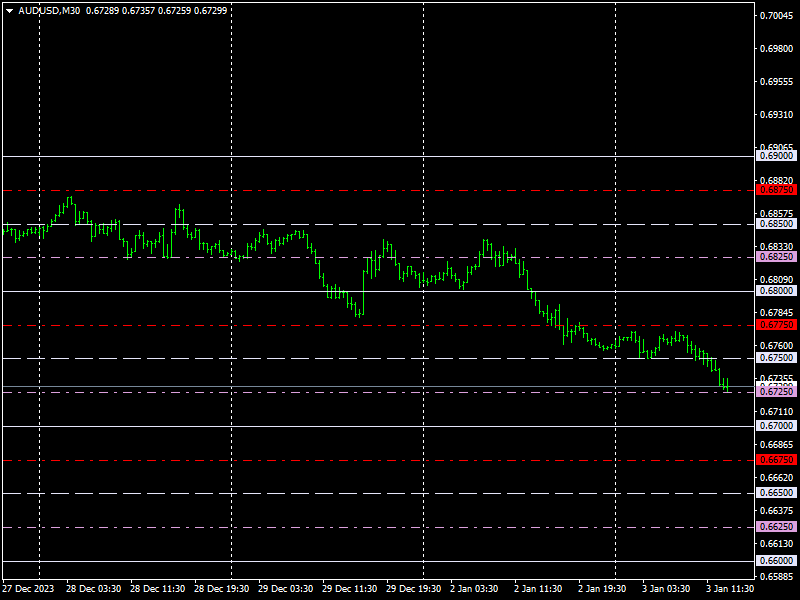
i want to plot an indicator ?? that will plot lines from current price on the chart at 100 and 200 pips above and below current price with lines at intervals 0f 25,50 75 pips and constantly centred on current price.
So if price slips below or above the closest even price ie .8600 -.8700 the grid will centre
lines to be able to be turned on or off and able to be coloredpic attached
Responded
1
Rating
Projects
25
28%
Arbitration
2
0%
/
0%
Overdue
1
4%
Loaded
2
Rating
Projects
172
23%
Arbitration
7
29%
/
43%
Overdue
4
2%
Working
3
Rating
Projects
44
30%
Arbitration
4
25%
/
25%
Overdue
0
Free
4
Rating
Projects
99
36%
Arbitration
0
Overdue
3
3%
Working
5
Rating
Projects
415
38%
Arbitration
86
44%
/
19%
Overdue
70
17%
Busy
6
Rating
Projects
45
20%
Arbitration
24
29%
/
46%
Overdue
12
27%
Free
7
Rating
Projects
40
25%
Arbitration
23
13%
/
70%
Overdue
8
20%
Loaded
8
Rating
Projects
0
0%
Arbitration
0
Overdue
0
Free
9
Rating
Projects
51
33%
Arbitration
0
Overdue
0
Free
10
Rating
Projects
3057
66%
Arbitration
77
48%
/
14%
Overdue
340
11%
Working
11
Rating
Projects
314
37%
Arbitration
6
50%
/
17%
Overdue
7
2%
Free
12
Rating
Projects
18
28%
Arbitration
2
0%
/
100%
Overdue
4
22%
Working
13
Rating
Projects
186
73%
Arbitration
4
100%
/
0%
Overdue
1
1%
Free
14
Rating
Projects
88
14%
Arbitration
30
30%
/
53%
Overdue
36
41%
Working
15
Rating
Projects
143
76%
Arbitration
0
Overdue
2
1%
Free
Similar orders
function (A) Add Transform combine the 4 Expert Advisors into just 1 Expert Advisor, maintaining the individuality of each one Leave in extern (false) or (true) :::::::::::::::::::::::::::::::::::::::::::::::::::::::::::::::::::::::::::::::::::::::::::::::::::::::::::::::::::::::::::::::::::::::::::::::: function (B) Add the function (false) or (true) INTO THE EXISTING FUNCTION: TradeSize = 0.01; (true) Function (C)
A calculator to determine the break even and profit level of any number of scale trades.
30 - 400 USD
This is not an EA that actually opens/closes trades. Instead this project involves creating a dashboard where the user can create a grid trade scenario with initial entry and scale trade pip distances, lot sizes for each trade, and draw down amount. It then calculates the break-even + profit level where all trades would close. For each new scale trade the BE+ point is recalculated which is then displayed on the
Hi I have the code in pinescript for an indicator that I need done in Ninja Trader, I wanted this indicator in NT bcs I chart in NT, and if the indicator could also have been an automated strategy even better. Please confirm that it will be an indicator and Automated Trading Strategy
Hello potential Freelancers I’m very new to trading so please bear with me as I try to explain what ‘m looking for. I'm currently getting signals ( XAUUSD )sent to me and I’m looking to find a person who can look at the data either watch account live, or I send the trade history. The bot my provider is using makes 100’s of trades a day and does very well on average. I’m also looking to have the following features
Trend Following with ML
50 - 200 USD
Hi guys I would like to k ow if someone has experience with machine learning models? I would like to train a model to identify if there is a range market or trendy market based on several parameters like EMA and ATR for example. If we use for example a 20 and 50 EMA and we measure the distance between both lines the algo should oearn if the trend is strong or weak. If it‘s steong it keeps trending and if it‘s weak
Hello The EA will work on particular zone choose by the user and can mark it on any TF and with some rules can open trades and mange the trade by some unique rules. the EA need to check the difference by RSI as well and with some extra rules . developer should have good attitude and good communication (englsih) with high performence and knowledge with coding EA
Hello I need a very simple indicator This indicator should show the highest floating or history drawdown of the account It means that it can display the highest number that the account drawdown to be displayed on the chart in this format max drawdown account(xxxx$$) ...date(00/00/00)time:(00:00) max drawdown currency ..( currency name with max drwadown) . (xxxx$$) date(00/00/00)time:(00:00) thanks
Hello The EA will work on particular zone choose by the user and can mark it on any TF and with some rules can open trades and mange the trade by some unique rules. the EA need to check the difference by RSI as well and with some extra rules . developer should have good attitude and good communication (englsih) with high performence and knowledge with coding EA. THREE TYPES OF ENTRIES 1: AGGRESSIVE 2: DIVERGENCE 3
I want to create an EA that can take bids according to information of a logic I have developed to give indication of a BUY or SELL opportunity. The EA will then be able to activate the BUY at the lowest possible position once the indicator clears it for a BUY and take bid upwards or identify the highest point and clears it for a SELL and take bids downwards. As you can see from example of JULY 2024 data to see how
Next Candle Probability
50 - 150 USD
Hello, I‘m interested in an indicator to predict the next candles probability (bullish or bearish). But honestly I have no idea how to do this. Would be interested in your opinion how we can create such an indicator. Please let me know if you‘ve done similar work
Project information
Budget
50 - 100 USD
For the developer
45
- 90
USD
Deadline
from 1 day(s)