Market Screener Indicator, Chart Dashboard

Job finished

Execution time 1 day
Feedback from customer
One of the best programmers, always willing he is good with communication and make additional solutions
Feedback from employee
good client. he have good communication and clear description about what he want. Thank you, friend.

Specification

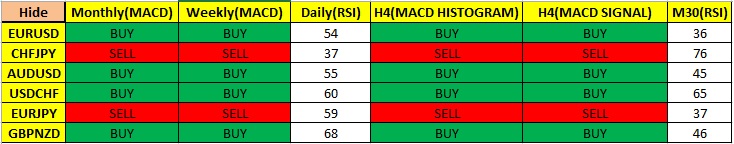
I am looking for a creative programmer who will be able to create a Market screener which will basically scan all Markets in the Market watch section. The screener should be able to monitor different markets simultaneously and display that current information in a table format (rows and columns) on the currently opened chart. All Markets should be scanned and only the Markets with all rows that are the same condition (either all BUY or all SELL) should show on the screener. Each Row should represent a timeframe which will be represented by a certain indicator. Each Column should represent the type of market being scanned. The screener should also have the option to scroll or page if there are too many markets to fit onto one page. The screener should also have the option to hide, if one needs to view the current chart.


Row 1(Monthly timeframe-Tipu MACD indicator)

Display either the colour GREEN with “BUY” or the colour RED with “SELL”: representing the Tipu MACD indicator condition on a Monthly timeframe

·         If Tipu MACD current histogram is above the MACD zero line: the cell should indicate a green colour and say “BUY”

·         If Tipu MACD current histogram is below the MACD zero level: the cell should indicate a red colour and say “SELL”


Row 2(Weekly timeframe-Tipu MACD indicator)

Display either the colour GREEN with “BUY” or the colour RED with “SELL”: representing the Tipu MACD indicator condition on a Weekly timeframe

·         If Tipu MACD current histogram is above the MACD zero line: the cell should indicate a green colour and say “BUY”

·         If Tipu MACD current histogram is below the MACD zero level: the cell should indicate a red colour and say “SELL”


Row 3(Daily timeframe-RSI indicator)

(This will be for the Daily timeframe which will use the RSI indicator and it will display the current RSI’s indicator level). (If possible to be a live representation of the RSI level on the Daily timeframe as the market moves).  


The RSI period default should be set to 14(it must have the option to change the period in the indicator inputs)

The cells within this row should only display the current RSI level on the daily timeframe


Row 4 (4 Hour timeframe-Tipu MACD indicator-HISTOGRAM)

Display either the colour GREEN with “BUY” or the colour RED with “SELL”: representing the Tipu MACD indicator condition on the 4 hour timeframe

·         If Tipu MACD current histogram is above the MACD zero line: the cell should indicate a green colour and say “BUY”

·         If Tipu MACD current histogram is below the MACD zero level: the cell should indicate a red colour and say “SELL”


Row 5 : (4 Hour timeframe-Tipu MACD indicator-SIGNAL LINE)

Display either the colour GREEN with “BUY” or the colour RED with “SELL”: representing the Tipu MACD indicator condition on the 4 hour timeframe

·         If Tipu MACD SIGNAL LINE(line #4 under Tipu MACD colour inputs) is above the MACD indicator zero line: the cell should indicate a green colour and say “BUY”

·         If Tipu MACD SIGNAL LINE(line#4 under Tipu MACD colour inputs) is below the MACD indicator zero level: the cell should indicate a red colour and say “SELL”


Row 6 (30 Minute timeframe-RSI indicator)


This will be for the 30 minute timeframe which will use the RSI indicator like column 3.The RSI period default should be set to 14(it must have the option to change the period in the indicator inputs). This timeframe will use the same RSI indicator as column 3

The cells within this row should only display the current RSI level on the 30 minute timeframe (if possible to be a live representation of the RSI level on the M30 timeframe as the market moves).


THE FOLLOWING RSI PARAMETERS SHOULD BE USER DEFINED (Rows 3 and 6 will use the same RSI and RSI settings)

RSI Period = user defined (14 as default)


THE FOLLOWING TIPU MACD PARAMETERS SHOULD BE USER DEFINED (Rows 1; 2; 4 & 5 will use the same TIPU MACD and TIPU MACD settings)

Fast EMA Period = user defined (16 as default)

Slow EMA Period = user defined (34 as default)

Signal SMA Period = user defined (18 as default)

The screener should scan all the markets in the Market watch and only display all the current Markets/pairs which have all rows as BUY or all rows as SELL for rows 1; 2; 4 and 5. If a certain market on the screener had all rows as “BUY” then suddenly one or more rows changes to “SELL” then this Market should be automatically removed from the screener and a pop up notification for this action should appear. I have attached the TIPU MACD indicator file and template with my default settings.


Responded

1
Developer 1
Rating
(31)
Projects
40
43%
Arbitration
0
Overdue
2
5%
Working
2
Developer 2
Rating
(36)
Projects
44
32%
Arbitration
6
17% / 33%
Overdue
8
18%
Working
3
Developer 3
Rating
(196)
Projects
318
35%
Arbitration
64
13% / 56%
Overdue
82
26%
Free
4
Developer 4
Rating
(124)
Projects
158
42%
Arbitration
20
60% / 20%
Overdue
8
5%
Free
5
Developer 5
Rating
(243)
Projects
430
34%
Arbitration
54
37% / 39%
Overdue
157
37%
Loaded
Similar orders
This is not an EA that actually opens/closes trades. Instead this project involves creating a dashboard where the user can create a grid trade scenario with initial entry and scale trade pip distances, lot sizes for each trade, and draw down amount. It then calculates the break-even + profit level where all trades would close. For each new scale trade the BE+ point is recalculated which is then displayed on the
Hi I have the code in pinescript for an indicator that I need done in Ninja Trader, I wanted this indicator in NT bcs I chart in NT, and if the indicator could also have been an automated strategy even better. Please confirm that it will be an indicator and Automated Trading Strategy
Hi guys I would like to k ow if someone has experience with machine learning models? I would like to train a model to identify if there is a range market or trendy market based on several parameters like EMA and ATR for example. If we use for example a 20 and 50 EMA and we measure the distance between both lines the algo should oearn if the trend is strong or weak. If it‘s steong it keeps trending and if it‘s weak
Hello I need a very simple indicator This indicator should show the highest floating or history drawdown of the account It means that it can display the highest number that the account drawdown to be displayed on the chart in this format max drawdown account(xxxx$$) ...date(00/00/00)time:(00:00) max drawdown currency ..( currency name with max drwadown) . (xxxx$$) date(00/00/00)time:(00:00) thanks
I want have the possibility to increase lotsize not alone by Lot-multiplier rather I want add a fix-lot increase for excample for 0,05 lot. I want have this for buy / sell and hedge-buy and hedge sell
Hello, I‘m interested in an indicator to predict the next candles probability (bullish or bearish). But honestly I have no idea how to do this. Would be interested in your opinion how we can create such an indicator. Please let me know if you‘ve done similar work
Profitable EA HFT 50 - 300 USD
From a long time i am searching for a profitable EA i have lost a lot , and now i have only 300$ to buy a profitable EA , i wish to say with 0 losses but some or most traders they don't want to hear this i am really tired of searching for a programmer to just create me a profitable EA with the least losses or zero losses maybe nearly 1 year i am searching i just need an HFT EA that can work very well on MT4,MT5
у нас есть стратегия, нам нужно написать mql5-код ​​для тестера стратегий МТ5,Цена договорная. Мой контакт @abbosaliyev из Telegram Программист должен знать РУССКИЙ ИЛИ УЗБЕКСКИЙ язык. Задание: разработать тестер, который использует шаблон условий на открытие и проверит весь исторический график на всех доступных таймфреймах. Остальная информация будет предоставлена ​​после согласования цены
New york session based strategy 9:30 open Price takes out buy side or sell side liquidity Usually using 15min high and lows 5m entry Price takes out that high/low and price must close strongly back into the zone Is price is above price we have a sell bias vis versa for buys Sl is at the high or low with option for “offset” for cushion Tp is usually the opposite High or low. Would like the option for set pips-points &
Utilizing the MQL5 MetaEditor Wizard, I created an Expert Advisor, having the following Signal indicators: I was able to optimize the EA and reached a backtest with the following specifications: I was able to reach a profit level of 30K, as indicated below. However, the Bot is not without faults and following the backtest, I started a forward test with real live data and the results were not so great. The EA took a

Project information

Budget
50+ USD
For the developer
45 USD
Deadline
to 3 day(s)