Specification
I am looking for a programmer who will be able to modify a market screener indicator which basically scans certain markets that I would like to trade Please do not change or modify how the Monthly and Weekly Columns currently work, I just need a programmer to modify the 4 Hour column and add a 15 minute column. The 4 Hour and 15 Minute columns should operate exactly the same (same operation on different timeframes). I have attached the indicators MQL5 file that needs to be modified.
So basically the indicator should display the following columns
1. Monthly(Do not change)
2. Weekly(Do not change)
3. 4 Hour(This column needs to be modified)
4. 15 Minute(This column needs to be added)
Column 3 (This will be for the 4 Hour timeframe which will use the RSI indicator and it will display the current RSI indicator condition).
The RSI period default should be set to 14(it must have the option to change the period in the indicator inputs)
The RSI indicator should have 4 levels: 30; 40; 60 and 70
For this column the indicator should first verify if both the Weekly and the Monthly timeframes correspond (MN=Buy and WK=Buy or vice versa). If one timeframe is Buy and the other is sell then the cell in the column should display the “Wait” condition.
Column 3 BUY condition:
The column must display one of the following outputs after confirming that both Monthly and Weekly timeframes correspond as Buy (both columns indicate a BUY condition at the same time):
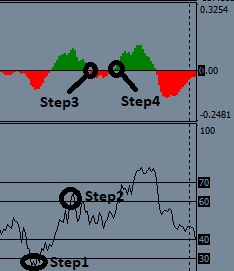
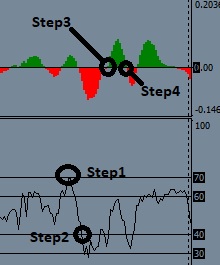
· Display “STAGE1”: If the RSI signal line is equal to or below the 30 level: the cell should Display “Stage 1”. The cell should Display “Stage 1” up until Stage 2 condition is met.
· Display “STAGE2”: If the RSI signal line is equal to or above the 60 level: the cell should Display “Stage 2”. The cell should Display “Stage 2” up until Stage 3 condition is met.
· Display “STAGE3 PULLBACK”: The cell should Display “Stage 3 Pullback” after the first histogram which appears below the TIPU MACD zero level. The cell should Display “Stage 3 Pullback” up until Stage 4 condition is met. (Note this TIPU MACD settings should be separate to the one that the Monthly and Weekly columns use and should have separate input settings in the indicator inputs, set to default TIPU MACD settings)
· Display “STAGE 4 IMPULSE” The cell should Display “Stage 4 Impulse” after the first histogram which appears above the TIPU MACD zero level. The cell should Display “Stage 4 Impulse” up until Stage 1 condition is met again. Then this Cycle should carry on until the Monthly and Weekly columns differ (one Buy and the other as Sell) then the column should display “Wait”.
Note: As soon as the Weekly and Monthly do correspond (as BUY and BUY or as SELL and SELL) the indicator should always look back at what the last Stage was using the above conditions and carry on from that stage.
Column 3 Sell condition:
The column must display one of the following outputs after confirming that both Monthly and Weekly timeframes correspond as Sell (both columns indicate a Sell condition at the same time):
· Display “STAGE1”: If the RSI signal line is equal to or above the 70 level: the cell should Display “Stage 1”. The cell should Display “Stage 1” up until Stage 2 condition is met.
· Display “STAGE2”: If the RSI signal line is equal to or below the 40 level: the cell should Display “Stage 2”. The cell should Display “Stage 2” up until Stage 3 condition is met.
· Display “STAGE3 PULLBACK”: The cell should Display “Stage 3 Pullback” after the first histogram which appears above the TIPU MACD zero level. The cell should Display “Stage 3 Pullback” up until Stage 4 condition is met. (Note this TIPU MACD settings should be separate to the one that the Monthly and Weekly columns use and should have separate input settings in the indicator inputs, set to default TIPU MACD settings)
· Display “STAGE 4 IMPULSE” The cell should Display “Stage 4 Impulse” after the first histogram which appears below the TIPU MACD zero level. The cell should Display “Stage 4 Impulse” up until Stage 1 condition is met again. Then this Cycle should carry on until the Monthly and Weekly columns differ (one Buy and the other as Sell) then the column should display “Wait”.
Note: As soon as the Weekly and Monthly do correspond (as BUY and BUY or as SELL and SELL) the indicator should always look back at what the last Stage was using the above conditions and carry on from that stage.
Column 4 (This will be for the 15 minute timeframe which will use the RSI indicator like column 3 or 4hour timeframe and it will display the current RSI indicator condition with the same setting as column3 or 4 hour timeframe).
THE FOLLOWING RSI PARAMETERS SHOULD BE USER DEFINED (Column 3 and 4 will use the same RSI settings)
RSI Period = user defined
THE FOLLOWING TIPU MACD PARAMETERS SHOULD BE USER DEFINED FOR BOTH TIPU MACD INDICATORS (Column 3 and 4 will use the same RSI settings)
Fast EMA Period = user defined
Slow EMA Period = user defined
Signal SMA Period = user defined