Job finished
Specification
I am looking for a MT5 indicator for showing maximum DD that occurred in candle-period.
When I say DD, I mean active drawdown even when trades are open.
I want this indicator in a separate window.
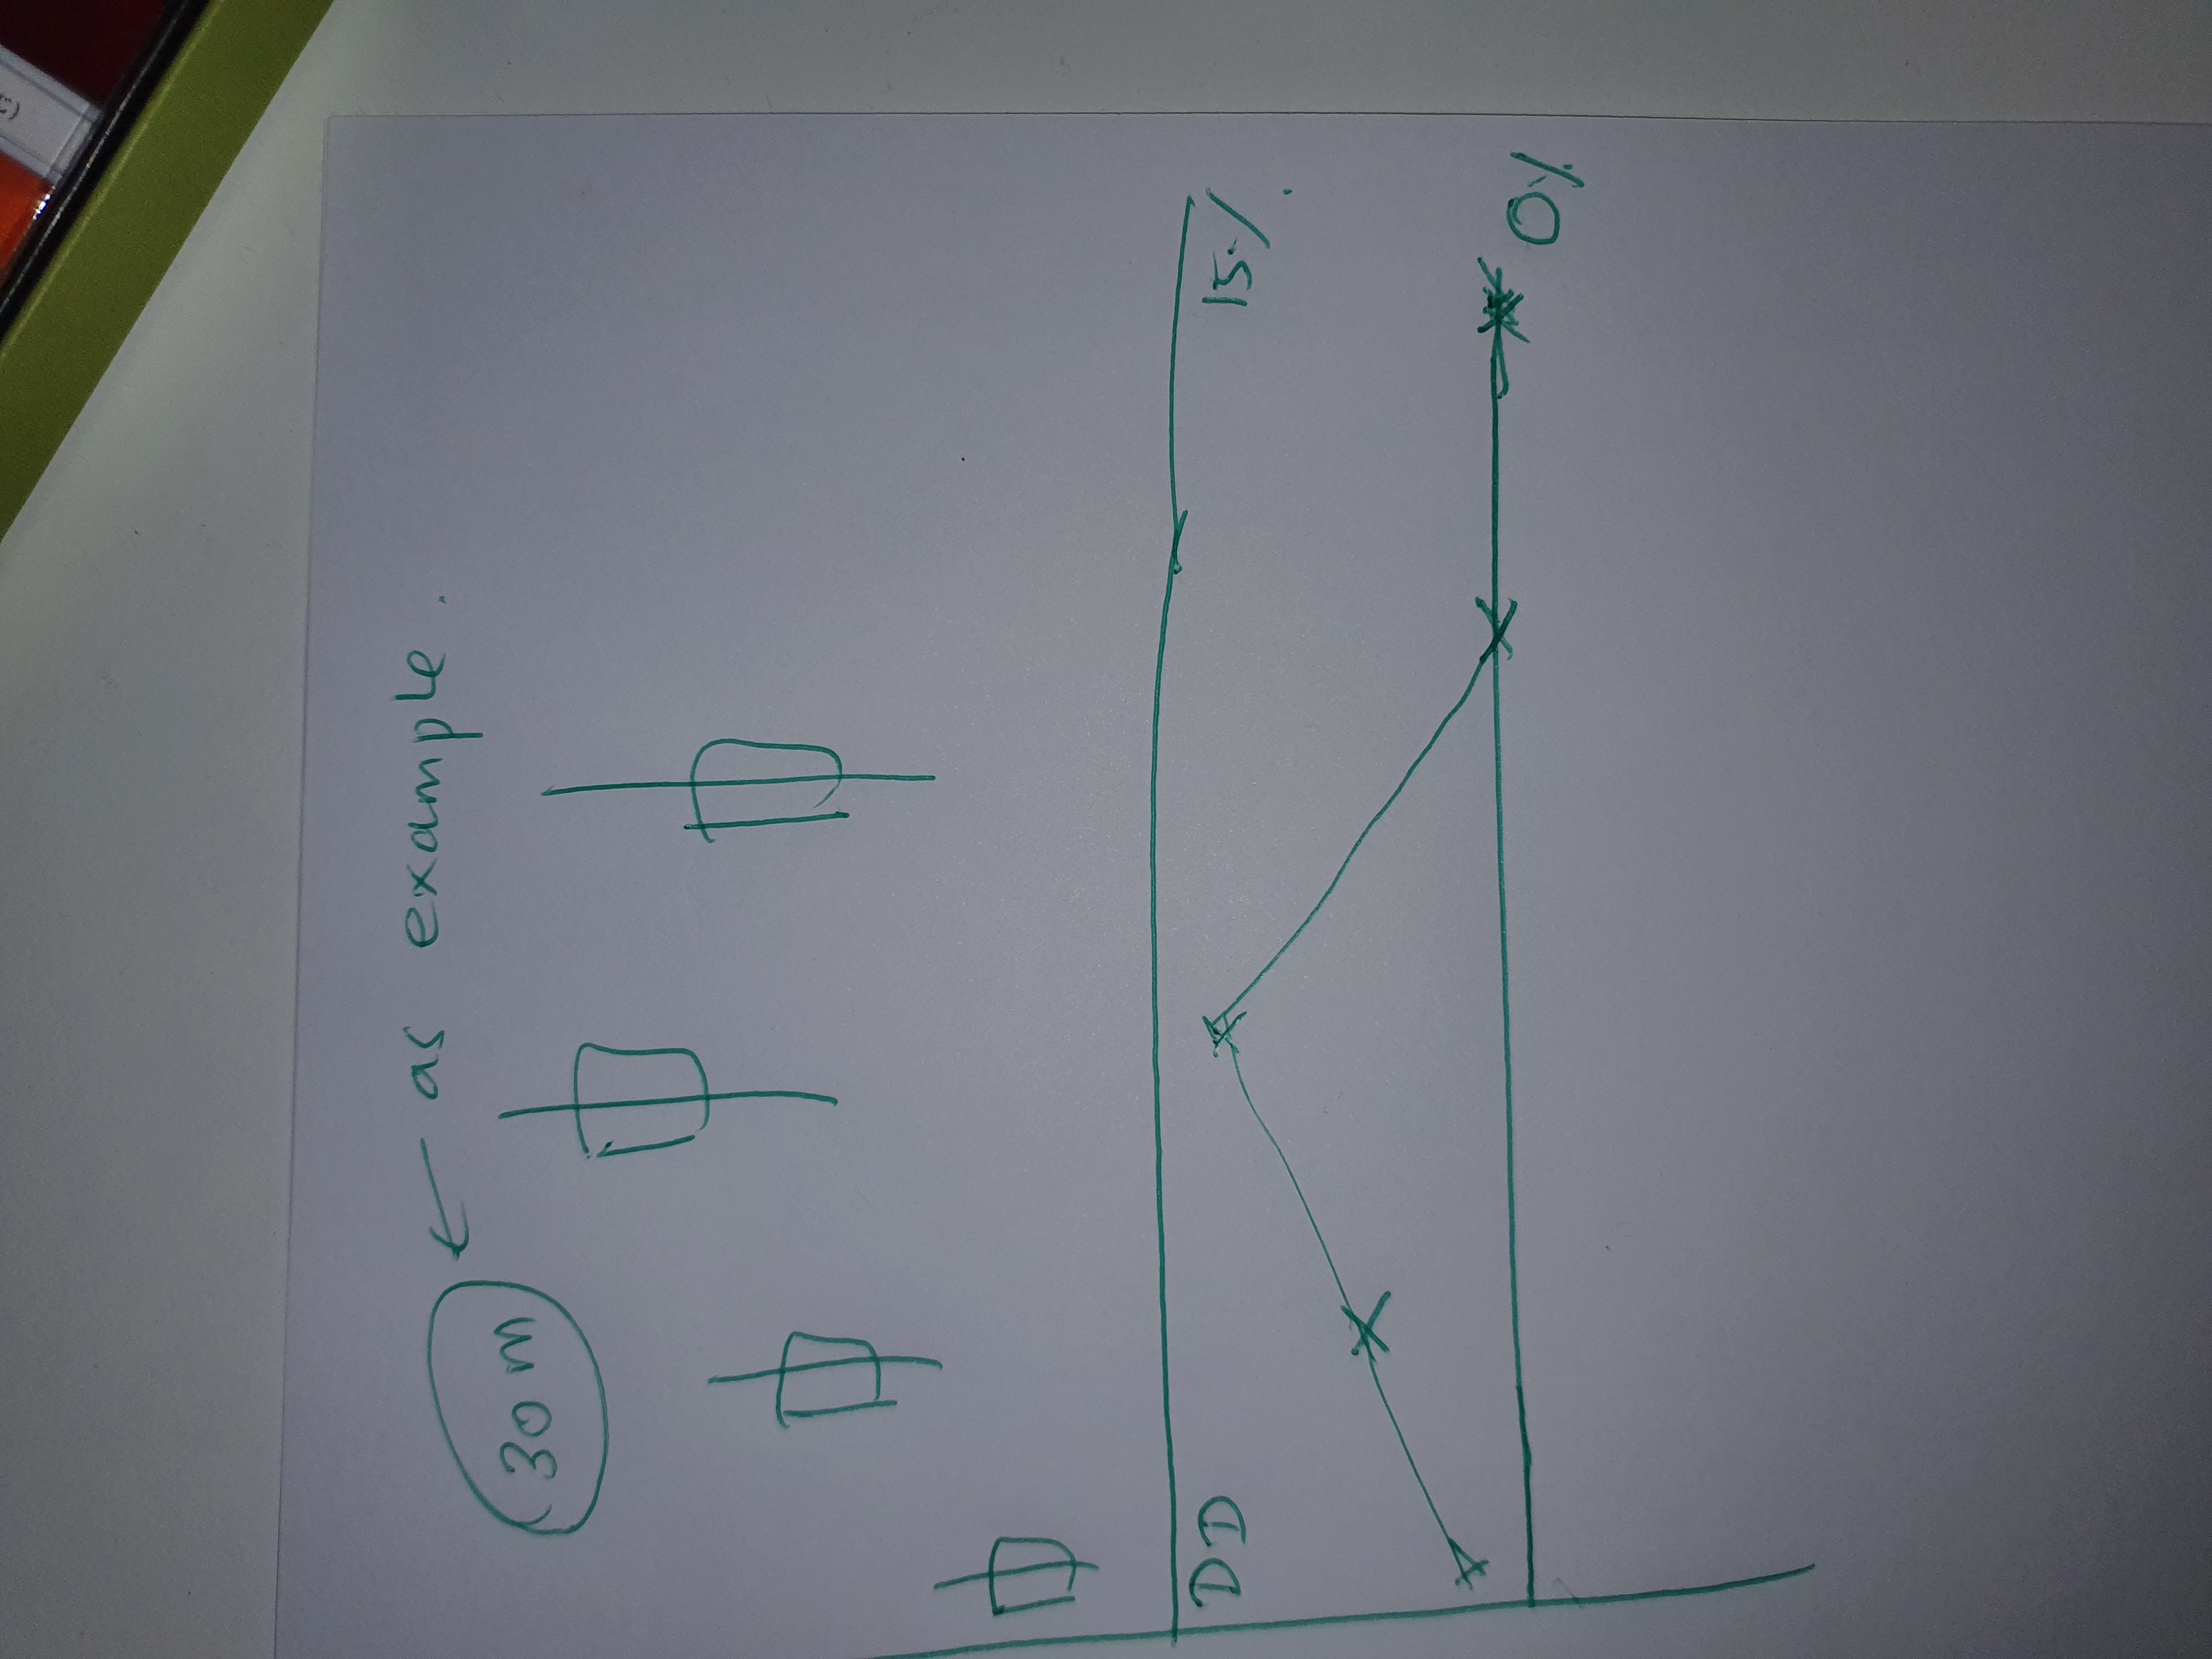
For example, if I select 30M as my timeframe, within that period whatever worst DD that I experienced should be plotted in the DD window.
Lets say you have 30M timeframe….and let’s say I start the indicator at 6am.
What is the maximum DD between 6am - 6.30am. Plot that.
What is the max DD between 6.30am - 7.00am. Plot that.
What is the max DD between 7am - 7.30am. Plot that.
.... for live candle...plot whatever is the highest so far. When that 30 minute finishes, show whatever the maximum DD was during that candle.
Please attached hand-drawn image as a rough example
It does not have to go back into the past…start from the moment that I open the indicator…and keep running into the future.
DD must be in percentage (%), and it should be current equity related to account balance.
Let’s say in a given time, your account balance is $10,000, but when a trade is open, the current equity is $9,000.
So the drawdown will be 10%
For this job, it’s a fixed budget of $30.