Specification
The most information is on two pictures. A 1-minute timeframe is used for quick control of the indicator's functionality (tick data). The job is based on 2 already existing indicators - 1st creates trend lines - Fractals - adjustable period extended 2 .mq4. The 2nd indicator - ATR -Average True range, is built in MT4 and defines the conditions for creating a pattern - NOTE, there MUST be used value of the previous, finished candle, not of the current one.
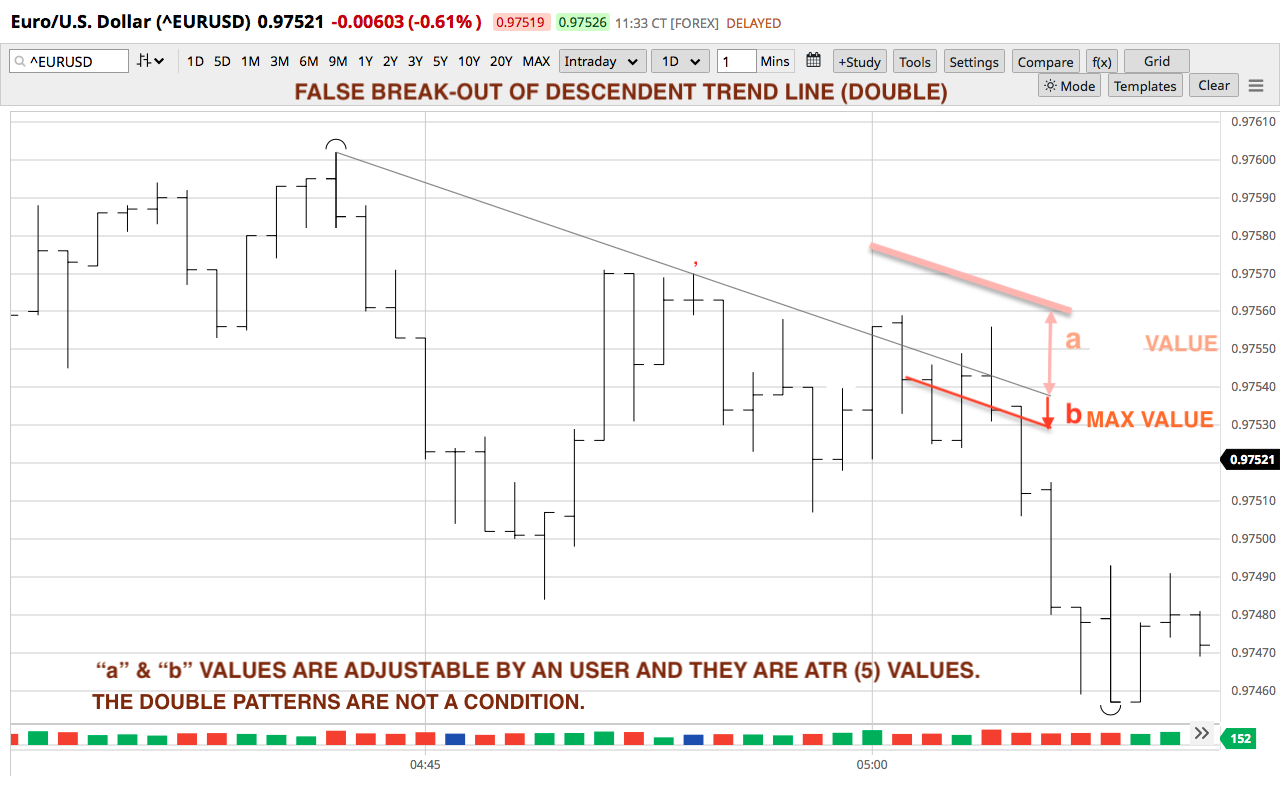
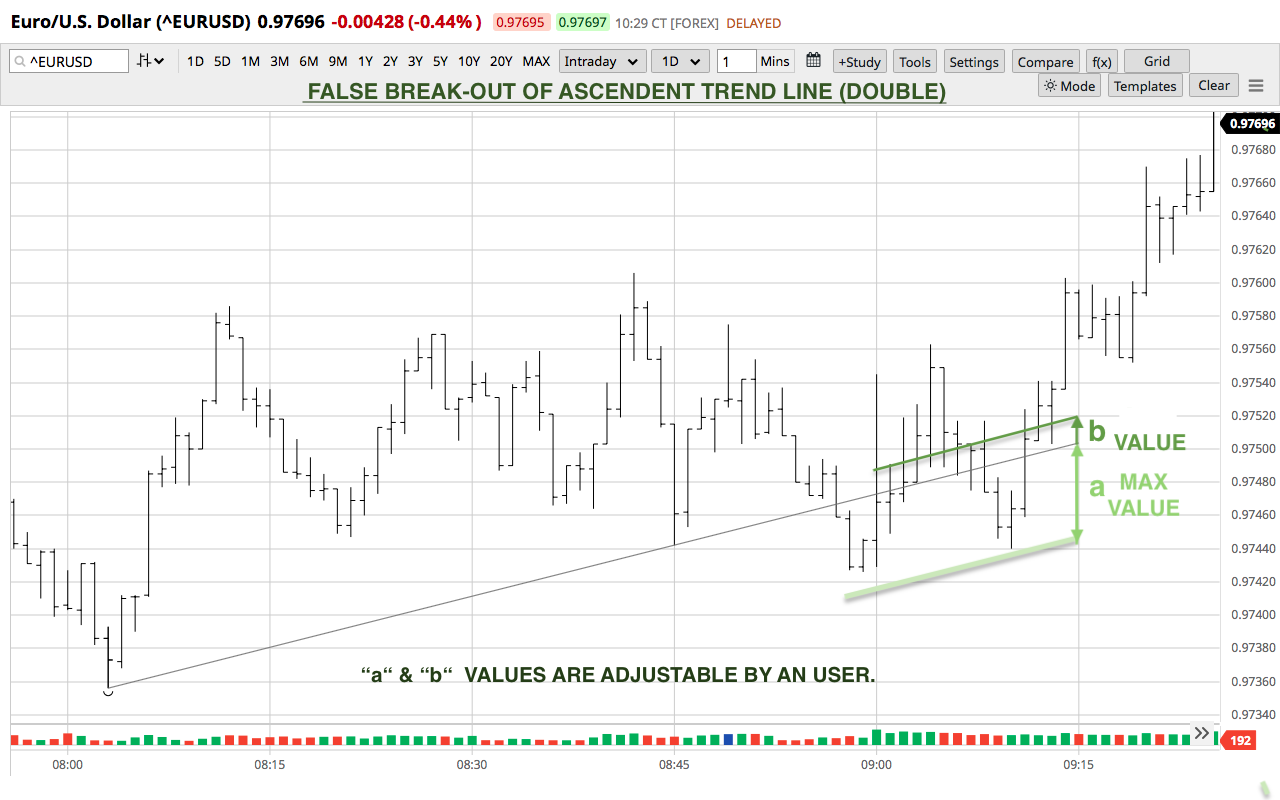
The “a” & “b” indicate conditions successively with defined values. The "a" is the break-out step and determines the maximum price distance from the line after the break-out. The "b" confirms that it is the false break-out and this value defines the exact opposite distance price from the trend line (0.1 - 10 ATR (5)).
Terms explanation:
ALINE = Ascending trend line : DLINE = Descending trend line,
B-candle - Breaking candle. FBO = False Break-Out.
Pseudo algorithm:
THE FBO OF ASCENDENT TREND LINE
1. OPEN B-candle < ALINE , THEN
2. (a) PRICE GETS > ALINE , Max N ATR (5) , THEN
3. (b) PRICE GETS N ATR (5) < ALINE.
THE FBO OF DESCENDENT TREND LINE
1. OPEN B-candle > DLINE), THEN
2. (a) PRICE GETS < DLINE, Max N ATR (5) , THEN
3. (b) PRICE GETS N ATR (5) > DLINE.
Since it is possible to repeat the pattern multiple times on 1 line, the length of the line for FBO after breaking is determined by the formula: Length from the beginning of the line + the distance after the 1st Break-out / 2.
This value is added to the time of 1st break-out of the line. Then the line stops being used.
Last condition: Patterns are created on unfinished candles in real time. The Close price of a candle can only be used rarely. The correctness check will be on online charts.