I need a chart to replicate/track my equity + Balance Curve into my mt4. Also this chart i need to be able to add Stochastic / Bollingerband / Moving average on the equity/balance curve. Besides the equity curve i would like the indicator to show the Line-chart of my win + 1 and my loss -1 which results in a win-loss curve. ( i will discuss this with the choosen developer in depth. ) More information on what i want
Greetings great developer, I am in search of a highly skilled developer to assist with an exciting project. I need to convert two open-source TradingView indicators to NinjaTrader 8 and implement a usage restriction based on computer IDs. If you have experience with NinjaTrader 8 coding please let me know. I’d be happy to discuss the details further
Hello, This is pretty simple and its an indicator with On/Off button 1-Off will remove all indicator from the chart. 2-On will put them all back again with the same settings
We need bot that trades when medium and low impact news hits It will release pending order both directions few min prior to news impact And will have certain risk management strategy attached Example If Monday and Tuesday news successful clears profits It will reduce risk for next news events until new week starts each week message on tg: Dstatewealthtrading NOTE: 4 YAERS OF EXPERIENCE UPWORD, YOU MUST BE A
I need someone the create a supertrend indicator based on Heikin Ashi candles instead of normal candles. Needs to be exactly the same as the supertrend (original one) + ha from tradingview. In m1,m5,m15 the indicator must have the same values found with the tradingview. Work that meets this requirement will be accepted ( depending on the broker and spread, however, a few pips of difference will be accepted)
Here is a detailed instruction for the coder to implement the vertical lines based on the BrainTrainSignalAlert indicator: --- **Task: Implement Vertical Lines for Alerts from BrainTrainSignalAlert Indicator** **Objective:** Create a system that adds vertical lines on specified timeframes (M5 or M30) whenever an alert is generated by the BrainTrainSignalAlert indicator on the H1, H4, and D1 timeframes. The lines
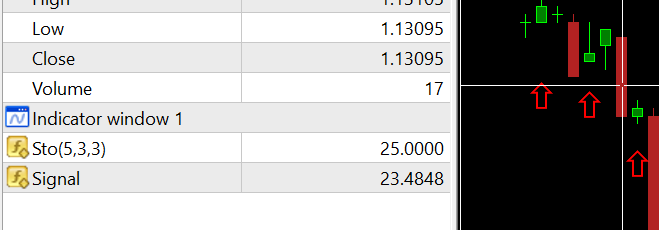
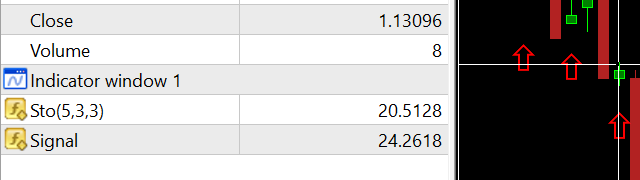
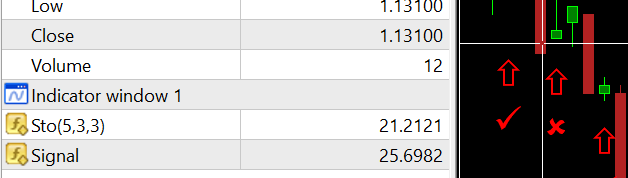
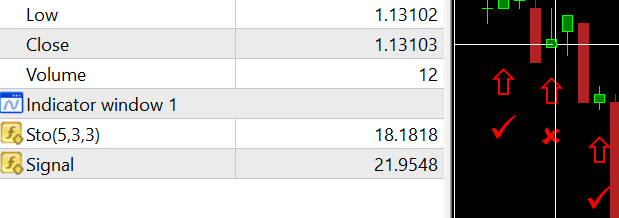
Hello Guys! I want to modify/fix the indicator that uses sequential type of entries (it calculates from 1 to 9) and if the conditions are met it provides an arrow (signal) with alert. The problem is that, sometimes (for unknown for me reasons) it repaints arrow signal. Like on the picture: Signal 1 - correct signal Signal 2 - correct signal Signal 3 - correct signal Signal 4 - repaints (signal 3 arrow dissapeared
Hi, I have a Live Data feature for my trading accounts that lets me check details like total open positions, number of lots, profits, etc. I need someone to add the number of pending orders to this live data. This is important for me to ensure that all accounts have the same number of pending orders, since I use a copy trading system. Also, there is a website where I check all the data. In this case, you would need
I came across an indicator that's perfectly good in catching spikes in boom amd crash but i would want it to be modified and to improve accuracy As a professional you will have to go through the indicator and explain to me the strategy with which the indicator was buid and tell me the possibility of improving it better
An EA that executes when the 21 and 55 SMA Cross on certain time frame also the EA will understand supply and demand levels and executes when price reacts on this levels specified and target/stoploss levels will be predetermined...also the robot will also comprise stochastic oscillator