Hello, everyone. I have a supertend indicator. I want to set candle color according to trend like attached image. If you have done it, I will give you more jobs. Thanks
I need an indicator, that displays fibonaccis drawn from ZigZag extreme to ZigZag extreme. The fibonacci levels included must be 0.0, 23.6, 38.2, 50.0, 61.8, and 100.0. For a Fibonacci drawn from ZigZag low (on left) to ZigZag high (on right), fibonacci 0 is at ZigZag low and fibonacci 100 is at ZigZag high. For a Fibonacci drawn from ZigZag high (on left) to ZigZag low (on right), fibonacci 0 is at ZigZag high
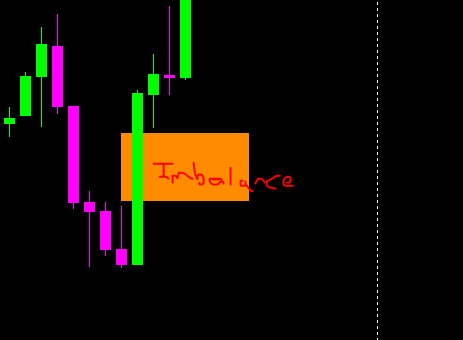
STRATEGY : Here’s a comprehensive specification document in English for developing your NinjaTrader bid/ask imbalance indicator: --- ### Bid/Ask Imbalance Indicator for NinjaTrader: Full Specifications #### **Objective**The goal is to develop a custom bid/ask imbalance indicator for NinjaTrader 8. The indicator will calculate and visualize bid/ask imbalances in real-time and on historical tick data using Tick Replay
Hello, I need a master pattern indicator. It is important that the lines of the indicator are generated for each candlestick, as there are also master pattern indicators where this is not the case. In the link is an example of a TradingView indicator, how the lines should be. It is also important that the lines are a buffer and I also need the source code. Here is the link
MT5 Indicator which Highlights Wicks Hi. I require an indicator which highlights the Wicks of a selected Time frame. So that even if I go to another time frame, the selected Time frame Wicks remain highlighted. For example If I select 'Weekly wicks' to be displayed, then if I got to a 4 hour chart, the Weekly wick area should remain highlighted. The Time Frame selections I want are: Monthly Wicks Weekly Wicks Daily
Here’s a comprehensive specification document in English for developing your NinjaTrader bid/ask imbalance indicator: --- ### Bid/Ask Imbalance Indicator for NinjaTrader: Full Specifications #### **Objective**The goal is to develop a custom bid/ask imbalance indicator for NinjaTrader 8. The indicator will calculate and visualize bid/ask imbalances in real-time and on historical tick data using Tick Replay. It will
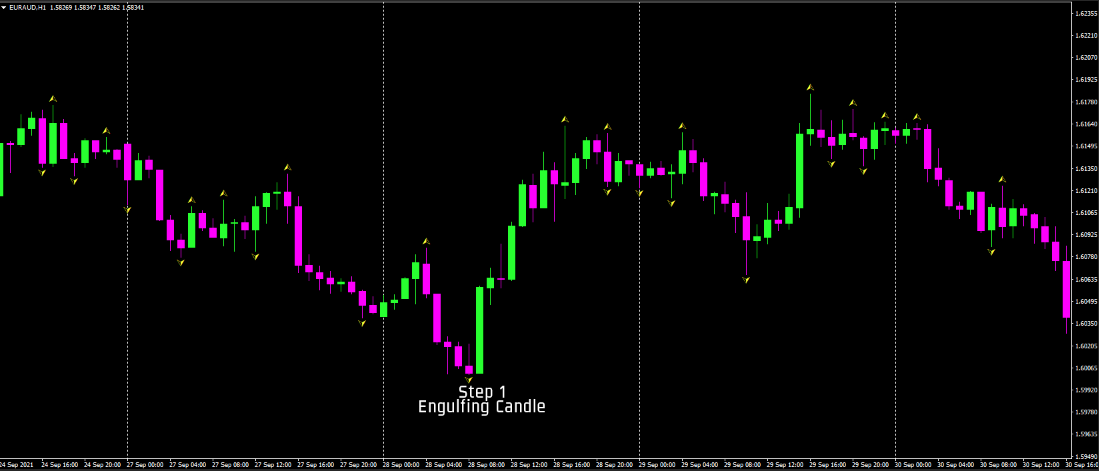
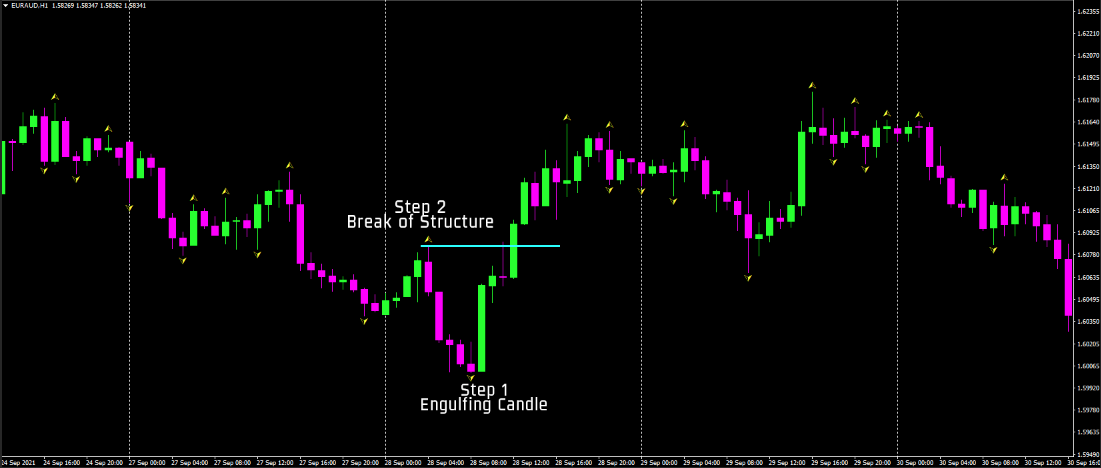
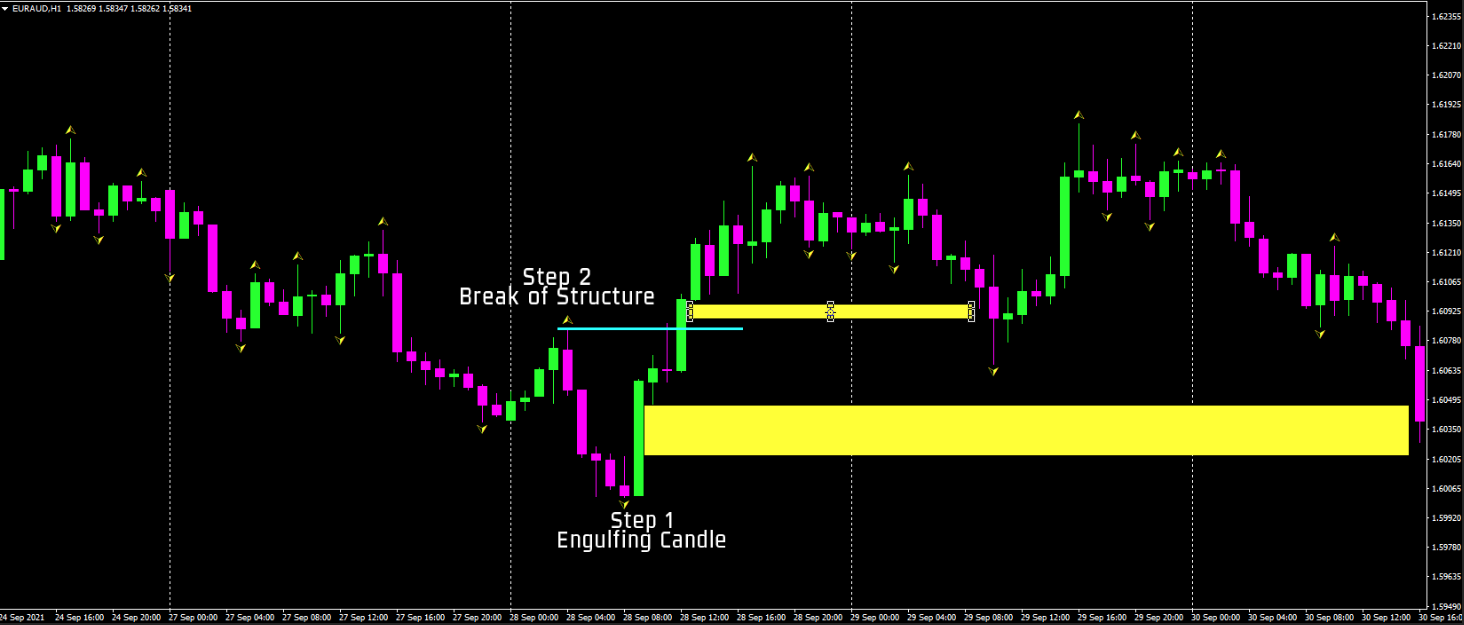
I would to develop a trading bot with some confluences I use TradeLocker Settings must be adjustable…… I am based in uk and very keen to move my strategy to trade automatically 1. Market Structure Break And Order block. By EmreKb 2. Rainbow Adaptive RSI By LuxAlgo 3. Multiple Moving Average using only 1 indicator By Myfye13 4. Average True Range Trailing Stops By HPotter we have to combine this four indicator into a
Preciso de um orçamento. Conversão de estratégias do TradingView para uso em MQL5. Todas são estratégias abertas, porém, não consigo contato com o desenvolvedor. 🔑 Principais recursos: - 🛠 Configurações personalizáveis do PSAR: ajuste o ponto inicial, o incremento e os valores máximos do PSAR para adaptar o indicador à sua estratégia. - 📏 Padronização: suavize a volatilidade padronizando os valores do PSAR
I am looking for an experienced MQL5 developer to build a custom indicator that displays retail stop-loss (SL) clusters on the chart. This indicator should integrate with an external data feed (preferably free, though I’m open to a paid solution if necessary) to show the order book of retail traders, highlighting where stop-losses are likely positioned. The goal is to use this information for entry and take-profit
Hello, i would like to have a fix on my plotted lines I use a liquidity strategy on the 1 hr time frame but the indicator that i am using for plotting the 1 hr lines is having a issue and printing the plot lines all over the place on the current 1 and 4 hr plot line as you can see in the screenshot this is very disturbing while i am trading can u fix that or just remove the current 1 hr plot line ?and or only show