Rules and confluences of the order panel
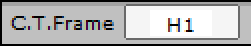
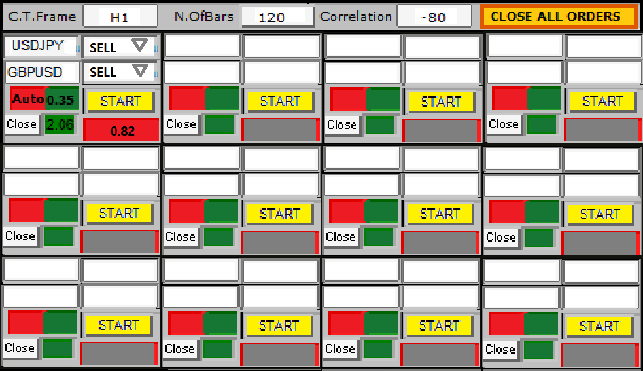
1. C.T. Frame, is the period chosen for calculations
2. N.OfBars, is the amount of candles for calculations

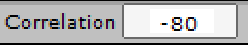
3. Correlation, if I type -80, it means that I will only work on pairs with negative correlation, (less than that the signs must be ignored).
4. The yellow START button.
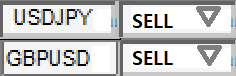
Every time you have confluence in 2 pairs, as in this example of GBPUSD/USDJPY, with 82%, the signal with the pairs should appear respectively within the windows, and when you click the START button with "double click", have to open short in 2 orders simultaneously (this following the drop box button rule).
And if I want to make an average price later on, I just double-click again on the START button.

5. CLOSE ALL ORDERS button, if I want to close all orders at any time, just make a “sequential triple click”, and all orders will be closed.

6. The red “Auto” button, for example if I type in the green field 0.35, every time the set of orders (GBPUSD/USDJPY) gives a profit of 0.35% equivalent to the account balance, then orders for these pairs are closed automatically.
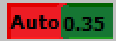
But if I type “0” (zero) in the field next to the “Auto” button, in this case the closing of these orders would be manual whenever I want, with a triple click on the “Close” button.

7. The value of 2.06 in the green field (next to the Close button) must match in the account currency the current negative or positive balance for the order set, (GBPUSD/USDJPY).

8. The correlation percentage warning button.
The value 0.82, (in the red field) shows that the current negative correlation is in the percentage of 82%, (above the stipulated 80). This should be updating in real time every 5 minutes and showing in the window. And whenever the value exceeds 0.80, the button must turn red, and when it goes below 0.80, it must change the color to "gray"

9. The drop box button.
I should have this editable outer option in front of each pair, so I can buy for example for both sides, or if I want to use positive correlation, buy and sell.
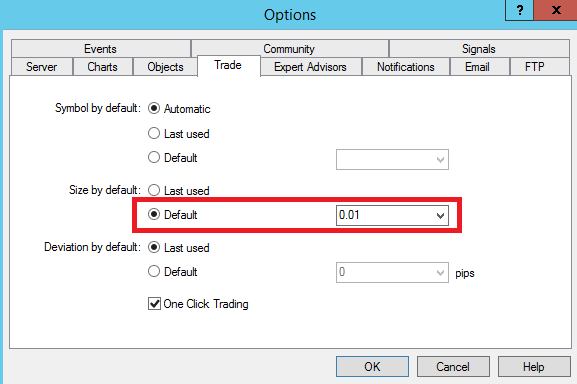
10. All orders must be executed with the default lot i have configured inside MT4, but leave it pre-configured in 0.01 (as in the image below).
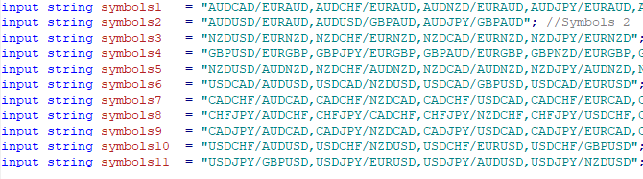
11. Put strings inside the code where I can type only the pairs I want, as in the example in this image below.
12. I recommend you assemble the grid of pairs with at least 12 sets of pairs according to the image here, keeping the colors, but if necessary the layout can be different in some details, what you need to keep is just the logic.
Similar orders
Looking for an experienced MQL5 developer to refactor and upgrade an existing Expert Advisor (EA) trading system. Current State: I have the fully working Phase 1 .mq5 source code. However, the execution rules are overly rigid, resulting in missed setups. Scope of Work (Phase 2): Refactor entry logic to support multi-timeframe EMA trend alignment (H4 structural trend + M5/M15 execution EMAs). Upgrade pullback state
Code An Loss Rate 90-100% MT5 EA , that can blow a 100 USD account a day ,with fixed TP of 3000 points and SL of 3000 For better Rate Calculations get an strategy that can lead to so
Makes it takes trades by it self buy and sell, it must use the higher signals, also when I press stop it must not pick any trades I want it to take trades automatically when I press start also close by it self
Hello looking for someone to convert an indicator from tradingview to Thinkorswim I have attached the codes from trading view Also, I like make it trigger (alert) a one-time alert when the trend changes, and can also create a custom watchlist column that flags symbols currently in a new trend so you can scan multiple stocks easily. And like the watchlist to show only fresh trend changes or the current trend direction
Version document : 1.0 Plateforme : TradingView Langage : Pine Script v6 Type : Indicateur d'analyse et d'aide à la décision (non-exécutant) 1. Présentation du projet Nom du produit ONYX SR V2 — Intelligent Support & Resistance Scalping System Objectif Créer un indicateur TradingView capable d'identifier automatiquement des opportunités de scalping basées sur : supports et résistances dynamiques ; action du prix ;
I have a EA/indicator that I want built. I should say 1st off dont know how to code myself so I will be using AI to verify that the source code is complete and matches the documents spec or if better so if you can not truly do the job do not waste either of out time. This is a idea I came.up wit and used AI to produce a framework for it.... and of course AI isn't 100% accurate so I need a knowledgeable quantitative
1. Use two EMAs: 20 and 50. If EMA 20 is above EMA 50 → uptrend (look for buys) If EMA 20 is below EMA 50 → downtrend (look for sells) 2. Wait for a pullback into the area between the two EMAs. - For buys: price must touch or move between EMA 20 and EMA 50 during the last few candles. - For stils: same idea, but in a downtrend. 3. Entry signal: Buy: a bullish engulfing candle in an uptrend after the pullback
I am looking for an experienced MQL4 developer to build a professional High-Frequency Trading (HFT) / Low-Latency Expert Advisor for MetaTrader 4 (MT4) . The EA will be deployed on an IC Markets Live account and should be optimized for the fastest possible execution using a low-latency VPS located in LD4 or NY4 . The primary instruments will be US30 and XAUUSD (Gold) . The goal is to create an EA capable of
HIGH-FREQUENCY M5/M15 CONCURRENT ENTRY SNIPER import time class HighFrequencySniper: def __init__(self): self.target_profit = 25.00 # Targeted Delta Move self.max_execution_time = 3600 # 1 Hour Sandbox (Seconds) self.lot_allocation = "CALIBRATED_TO_RISK" def execute_hft_scan(self, current_price, m5_rsi, m15_order_block): print(f"[SCANNING] Current Kernel Metric: ${current_price:.2f
I need a trading bot, please i need this project urgently and when messaing me kindly send me samples of past works and dont forget i need the project to be done as soon as possible