Job finished
Specification
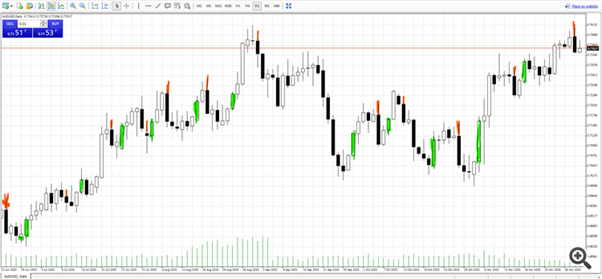
Price Reversal Candle Indicator:
When a first buy price action candle formed after Sell price action candle then buy price action candle is called BUY Price reversal Candle.
When a first Sell Price action candle is formed after buy price action candle then sell price action candle is called SELL price reversal Candle.
Take this from previous Job:
Buy Price action Candle : Candle which is closed above previous candle high
Sell Price Action candle : Candle which is closed below previous candle low
Parameter :
Number of candle to draw: Default 500
Time Frame: Drop down of all time frame
BUY Price reversal Candle-->candle is marked with green arrow below low of candle
SELL price reversal Candle--> candle is marked with Red arrow above high of candle
All Green color are BUY price reversal candle ,All RED color are SELL reversal Candle.
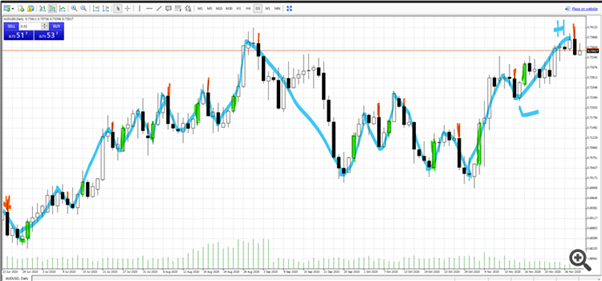
Price Reversal Zig Zag:
Following condition has to check when only a new Price Reversal Candle is formed. NOT FOR ALL CANDLES.
When a Buy Price Reversal Candle is formed ,prior four candle (four is default) close is considered and lowest price point is marked as ZigZag low
When a Sell Price Reversal Candle is formed ,prior four candle (four is default) close is considered and highest price point is marked as ZigZag high
Parameter:
Number of prior candle to mark high /Low : 4 (default)
Time Frame: Drop down of all time frame
Trend Analyzer : (use Price Reversal Zig Zag as baseline code)
Parameter:
Price marking-->Close or low/high (give me in Drop down option)
Number of prior candle to mark high /Low: 4 (default)
Time Frame: Drop down of all-time frame
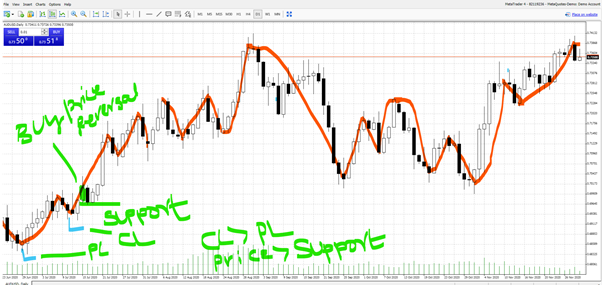
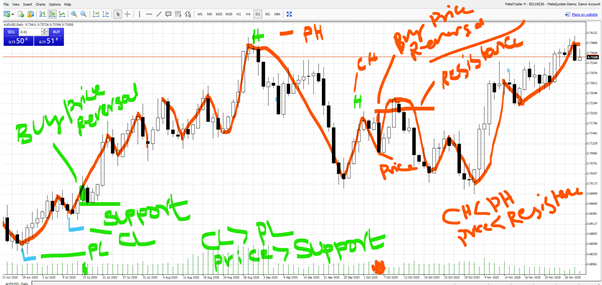
When a buy price action candle is formed, Low of buy price action candle is marked as Support Line.
When a Sell price action candle is formed, high of sell price action candle is marked as Resistance Line.
Support and Resistance line need to be drawn on chart and will get redrawn whenever price action candles are formed as per above rules
Rule:
Buy Trend:
When Current Low is greater than previous low
AND
Current Price is higher than support line
Sell Trend:
When Current high is lesser than previous high
AND
Current Price is lower than resistance line
Simple Trend analyses (use base Price Reversal Zig Zag)
Parameter:
Time frame:
Price type: Last candle close /Current price.
and all parameter from Price Reversal Zig Zag
When a buy price action candle is formed, Low of buy price action candle is marked as Support Line.
When a Sell price action candle is formed, high of sell price action candle is marked as Resistance Line.
Support and Resistance line need to be drawn on chart and will get redrawn whenever price action candles are formed as per above rules
When (current price/Last closed candle price) is above current high and Price is above support line , then it buy trend
When (current price/Last closed candle price) is below current low and Price is below resistance line , then it Sell trend
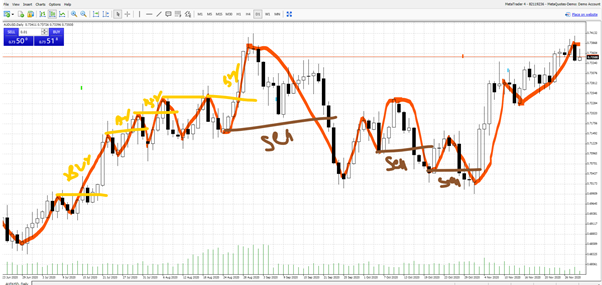
Draw line for high /low as in chart
Trade Volume:
When a buy price action candle is formed then Buy volume should be given.
When a Sell price action candle is formed then Sell volume should be given.
Sell Risk : High of Sell Price action candle+ (N*ATR)
Buy Risk : Low of Sell Price action candle- (N*ATR)
N can be less than one.
Current account available balance *risk percentage = $ to be trade in each trade
$ derived above step should be maximum loss. Volume need to be derived based on that ..
based on Risk above ,Volume should calculated to have maximum loss of $.
It is not that I am trading fixed dollar.. volume is chosen as such my maximum loss is $ calculated ( Current account available balance *risk percentage)
How much volume to have my maximum loss as Current account available balance *risk_percentage ?