I need a simple custom indicator for Metatratder 4

MQL4 Indicators

Job finished

Execution time 3 days

Specification

Hello everybody,

 I need a simple custom indicator programmed for metatrader 4.

It needs to draw a graphic similar to  this one(ignore the numbers along the axis's ):
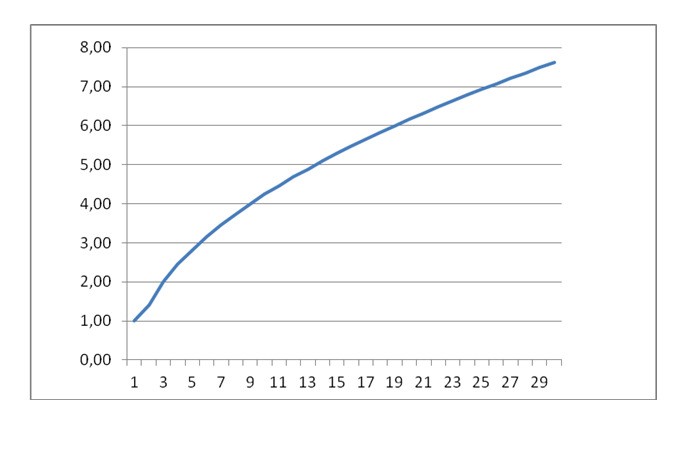


The objectives are:

1.The client has to be able to move and place the graphic(the origin of the coordinate system)  on any chosen bar in  a price chart in metatrader 4 in exactly the same manner as we'd move and adjust a common trend-line cross.

2.The graphic has to have an option to be inverted relative to the "X" axis (drawn as reciprocal values bellow the X axis).


  The numbers(values) along the  "X" axis are to be connected to the consecutive number of the bars for the given time frame of the price chart it is applied to,e.g. when I move the origin of the coordinate system  of the indicator on any given bar in the price chart this bar becomes "1" and all the next bars are getting their consecutive values - 2,3,4...;This of course has to be valid for any time frame chosen in the price chart - 1min.,5min.,...1hour etc.Also the bars relative numbering needs to be displayed along the "X" axis of the indicator. 

  The numbers(values) along the "Y" axis  are predetermined and only needs to be coded in(I'll send the number sequence upon beginning of work) .I'll also need a custom option for these values(all of them as a batch,not individually) to be able to be multiplied by a fixed multiplier e.g 1,2,5...100, etc. AND an option to be able to be multiplied by the current value of the standard ATR indicator for the given time frame.

The total number of  key points (values) on each axis is 111.  I.e. there will be 111 predetermined values for the "Y" axis and 111 place holders for bars along the "X" axis.


So,in short I need an indicator which will be representing the relative numbering of the bars in a given time frame as "X" and a set of predetermined values as "Y",it will draw the graphic based on these values and it will have the flexibility to be manually placed  on any given bar in the chart(same as a trend-line would).

 I hope I described the requirements clear enough,if there is any questions,please ask.


Thanks 

P.S. This is a first from a multiple indicator and experts projects which will follow shortly,so I'm looking for a developer with whom we could work on long term basis.  


P.P.S. Since there was some confusion among the applicants about the graphic I'm attaching another picture:


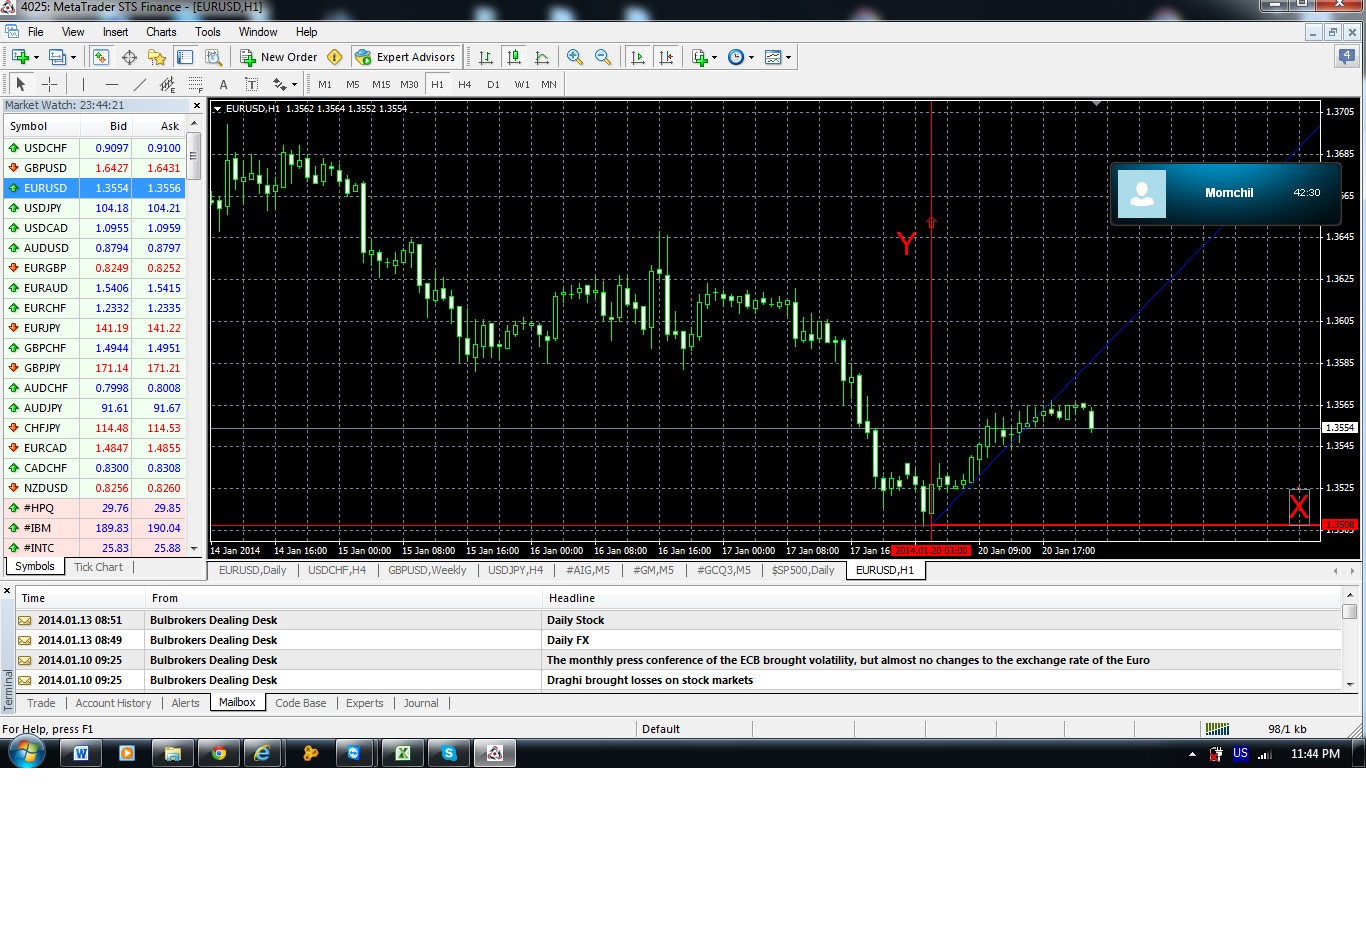
...so,the indicator will need to represent a coordinate system in the same manner as the two red crossing lines across the entire graphic here(but the blue line(the graphic itself) will be  a curve much like the one from the first image).The coordinate system origin has to be movable(the lines will follow of course).The "X" axis will take it's values directly from the consecutive number of the bars.E.g. when the origin is placed on particular bar this bar becomes "1" or "0" and all the bars to the right of it become 2,3,4,...The relative numbering of the bars will be displayed along the "X" axis and the graphic itself will be calculated(drawn) based on these key points(for X)

For "Y" axis I will supply all the values.They are fixed 111 values.So there will be 111 points on "Y" axis.And respectively 111 points(bar places) on "X" .

I will need three options (manually selected) for altering the "Y" values.

1.Multiplication by chosen multiplier(1,2,...100...1000)

2.Multiplication by the current value of an ATR indicator(it will be build in). 

3.Inverting all the values to negative,so the graphic gets drawn below the "X" axis.


 That is it.

List of values to be entered for Y and the bars consecutive number(counted to the right from the origin) for X.   It's that simple.

And a couple of manual options for the values for Y. 


For those of you who are into mathematics,the graphic is an approximation of a Normal Distribution.

Responded

1
Developer 1
Rating
(548)
Projects
825
73%
Arbitration
15
53% / 13%
Overdue
193
23%
Working
2
Developer 2
Rating
(30)
Projects
93
49%
Arbitration
18
56% / 17%
Overdue
38
41%
Free
3
Developer 3
Rating
Projects
0
0%
Arbitration
2
0% / 100%
Overdue
0
Free
4
Developer 4
Rating
(47)
Projects
140
49%
Arbitration
9
56% / 0%
Overdue
27
19%
Free
5
Developer 5
Rating
(54)
Projects
164
43%
Arbitration
43
47% / 16%
Overdue
58
35%
Free
6
Developer 6
Rating
Projects
1
0%
Arbitration
0
Overdue
1
100%
Free
Similar orders
Greetings, As the title suggests, I am trying to convert an indicator that calls itself via an iCustom call like this. iMAArray_Buffer[loop_1] = iCustom ( NULL , Selected_TF, MQLInfoString ( MQL_PROGRAM_NAME ), "calculate" , RPeriod, MType, MPeriod, 1 , shift); Full code will not be provided, only the position that needs fixing. I cannot get this working in MQL5 but the original code runs smoothly in MQL4. Please
I need a chart to replicate/track my equity + Balance Curve into my mt4. Also this chart i need to be able to add Stochastic / Bollingerband / Moving average on the equity/balance curve. Besides the equity curve i would like the indicator to show the Line-chart of my win + 1 and my loss -1 which results in a win-loss curve. ( i will discuss this with the choosen developer in depth. ) More information on what i want
Greetings great developer, I am in search of a highly skilled developer to assist with an exciting project. I need to convert two open-source TradingView indicators to NinjaTrader 8 and implement a usage restriction based on computer IDs. If you have experience with NinjaTrader 8 coding please let me know. I’d be happy to discuss the details further
Hello, This is pretty simple and its an indicator with On/Off button 1-Off will remove all indicator from the chart. 2-On will put them all back again with the same settings
Trading bot 300+ USD
We need bot that trades when medium and low impact news hits It will release pending order both directions few min prior to news impact And will have certain risk management strategy attached Example If Monday and Tuesday news successful clears profits It will reduce risk for next news events until new week starts each week message on tg: Dstatewealthtrading NOTE: 4 YAERS OF EXPERIENCE UPWORD, YOU MUST BE A
I need someone the create a supertrend indicator based on Heikin Ashi candles instead of normal candles. Needs to be exactly the same as the supertrend (original one) + ha from tradingview. In m1,m5,m15 the indicator must have the same values ​​found with the tradingview. Work that meets this requirement will be accepted ( depending on the broker and spread, however, a few pips of difference will be accepted)
Here is a detailed instruction for the coder to implement the vertical lines based on the BrainTrainSignalAlert indicator: --- **Task: Implement Vertical Lines for Alerts from BrainTrainSignalAlert Indicator** **Objective:** Create a system that adds vertical lines on specified timeframes (M5 or M30) whenever an alert is generated by the BrainTrainSignalAlert indicator on the H1, H4, and D1 timeframes. The lines
Hello Guys! I want to modify/fix the indicator that uses sequential type of entries (it calculates from 1 to 9) and if the conditions are met it provides an arrow (signal) with alert. The problem is that, sometimes (for unknown for me reasons) it repaints arrow signal. Like on the picture: Signal 1 - correct signal Signal 2 - correct signal Signal 3 - correct signal Signal 4 - repaints (signal 3 arrow dissapeared
Hi, I have a Live Data feature for my trading accounts that lets me check details like total open positions, number of lots, profits, etc. I need someone to add the number of pending orders to this live data. This is important for me to ensure that all accounts have the same number of pending orders, since I use a copy trading system. Also, there is a website where I check all the data. In this case, you would need
I came across an indicator that's perfectly good in catching spikes in boom amd crash but i would want it to be modified and to improve accuracy As a professional you will have to go through the indicator and explain to me the strategy with which the indicator was buid and tell me the possibility of improving it better

Project information

Budget
25 - 35 USD
VAT (20%): 5 - 7 USD
Total: 30 - 42 USD
For the developer
22.5 - 31.5 USD