Job finished
Specification
Hi,
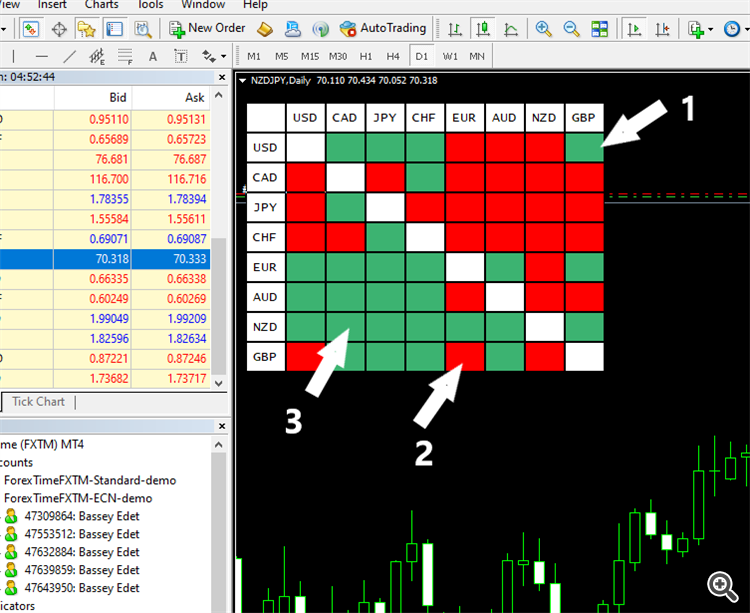
BULLISH EXAMPLE, BULLISH EXAMPLE, BULLISH EXAMPLE (GREEN BOX)
I want you to update my indicator. If you look at the image above number 1, You will notice 2 things
a. USD and GBP intersect at that point
b. The color of the box is green.
What I want the Indicator to do the follow, using example 1 in the Image:
1. Use the Current timeframe of GBPUSD
2. If the box is green use this formula { (Current Price – Open)/(High – Open) } x 100
3. Round the value up to the nearest single whole number. E.g. if the value in number 2 above is 79%, round it up to 8, if it is 73%, round it up to 7.
4. If current M1 High > previous M1 High, = (+) (works with M1 Timeframe Only)
5. If current M1 High < previous M1 High, = (-) (works with M1 Timeframe Only)
6. If Current tick price > 10th tick price ago = Strong (Works with the Current Timeframe only)
7. If Current tick price < 10th tick price ago = Weak (Works with the Current Timeframe only)
8. E.g if box in this example is green, and values in number (2 and 3) are calculated, and current M1 close > previous M1, and Current tick price > 10th tick price ago, then write value (7,strong,+) in the USD and GBP intersection box
9. Update in real time.
================================================================================
BEARISH EXAMPLE, BEARISH EXAMPLE, BEARISH EXAMPLE (RED BOX)
If you look at the image above number 2, You will notice 2 things
a. GBP and EUR intersect at that point
b. The color of the box is red.
What I want the Indicator to do the follow, using example 2 in the Image:
1. Use the Current timeframe of EUR GBP
2. If the box is red use this formula { (Open - Current Price)/( Open - Low) } x 100
3. Round the value up to the nearest single whole number. E.g. if the value in number 2 above is 85%, round it up to 9, if it is 84%, round it up to 8.
4. If current M1 Low < previous M1 Low, then value is (+) (works with M1 Timeframe Only)
5. If current M1 Low > previous M1 Low, then value is (-) (works with M1 Timeframe Only)
6. If Current tick price < 10th tick price ago = Strong (Works with the Current Timeframe only)
7. If Current tick price > 10th tick price ago = Weak (Works with the Current Timeframe only)
8. E.g if box in this example is red, and values in number (2 and 3) are calculated, and current M1 close < previous M1 close, and Current tick price < 10th tick price ago then, write the value (8,strong,+) in the GBP and EUR intersection box
9. Update in real time.
================================================================================
BULLISH EXAMPLE, BULLISH EXAMPLE, BULLISH EXAMPLE (GREEN BOX)
If you look at the image above number 3, You will notice 2 things
a. NZD and CAD intersect at that point
b. The color of the box is green.
What I want the Indicator to do the follow, using example 2 in the Image:
1. Use the Current timeframe of NZDCAD
2. If the box is green use this formula { (Current Price – Open)/(High – Open) } x 100
3. Round the value up to the nearest single whole number. E.g. if the value in number 2 above is 99%, round it up to 10, if it is 09%, round it up to 1.
4. If current M1 High > previous M1 High, then value is (+) (works with M1 Timeframe Only)
5. If current M1 High < previous M1 High, then value is (-) (works with M1 Timeframe Only)
6. If Current tick price > 10th tick price ago = Strong (Works with the Current Timeframe only)
7. If Current tick price < 10th tick price ago = Weak (Works with the Current Timeframe only)
8. E.g if box in this example is green, and values in number (2 and 3) are calculated, and current M1 close < previous M1 close, and Current tick price < 10th tick price ago then, write the value (1, weak, -) in the NZD and CAD intersection box
9. Update in real time.
Others:
1. Show pop up notification. E.g if all USD 7 rows are all green at a timeframe, show popup notification of “USD Strong on the value of the current timeframe e.g daily”. E.g if all NZD 7 row are all red at a timeframe, show popup notification of “NZD weak on the value of the current timeframe e.g M30”.
2. Apply this to all boxes.
3. There should be an option to (Turn on/ Turn off) No.4 – No. 7
