Market Condition Evaluation based on standard indicators in Metatrader 5 - page 170
You are missing trading opportunities:
- Free trading apps
- Over 8,000 signals for copying
- Economic news for exploring financial markets
Registration
Log in
You agree to website policy and terms of use
If you do not have an account, please register
Forum on trading, automated trading systems and testing trading strategies
Forecast for Q2'16 - levels for Brent Crude Oil
Sergey Golubev, 2016.04.27 16:51
U.S. Commercial Crude Oil Inventories: Correction with 44.24 level as a target
2016-04-27 14:30 GMT | [USD - Crude Oil Inventories]
[USD - Crude Oil Inventories] = Change in the number of barrels of crude oil held in inventory by commercial firms during the past week.
==========
"U.S. commercial crude oil inventories (excluding those in the Strategic Petroleum Reserve) increased by 2.0 million barrels from the previous week. At 540.6 million barrels, U.S. crude oil inventories are at historically high levels for this time of year. Total motor gasoline inventories increased by 1.6 million barrels last week, and are well above the upper limit of the average range. Finished gasoline inventories decreased while blending components inventories increased last week. Distillate fuel inventories decreased by 1.7 million barrels last week but are well above the upper limit of the average range for this time of year. Propane/propylene inventories rose 2.3 million barrels last week and are above the upper limit of the average range. Total commercial petroleum inventories increased by 5.2 million barrels last week."
==========
Crude Oil M5: bearish breakdown. The price broke 200 SMA/100 SMA reversal area to below to be reversed to the primary bearish market condition. Price is breaking 45.67 support level for the bearish breakdown to be continuing with 44.24 as the nearest bearish target.==========
Crude Oil H4: secondary correction within the primary bullish to be started. The price is on bullish condition with the secondary correction to be started on open H4 bar for now, with the ranging within the following key support/resistance levels:
RSI indicator is estimating the correction to be continuing in the near future.
SUMMARY : bullish
TREND : correctionForum on trading, automated trading systems and testing trading strategies
Press review
Sergey Golubev, 2016.04.28 07:54
USD/JPY Intra-Day Fundamentals: Japan Monetary Policy Statement and 289 pips price movement
2016-04-28 03:01 GMT | [JPY - Japan Interest Rate Decision]
if actual > forecast (or previous one) = good for currency (for JPY in our case)
==========
USD/JPY sees a 200-pips fall:
"The yen jolted nearly 200-pips higher versus the American dollar in a knee-jerk reaction to the BOJ policy announcement, as the central bank keeps monetary policy steady, maintains 80 trln Yen base money target and 0.1% negative interest rate. USD/JPY plunged to fresh one-week lows of 108.78 immediately after the BOJ decision, before recovering some ground to now trade around 109.25, still down –2.03% on the day."
"The Japanese currency received a huge boosts as markets were expecting more easing from the BOJ in wake of the recent appreciation in the yen against the greenback and underlying subdued price trends. However, markets were disappointed as BOJ decided to adopt loan support programme only for banks in areas hit by southern Japan quake."
==========
USD/JPY M5: 289 pips price movement by Japan Monetary Policy Statement news event :
Forum on trading, automated trading systems and testing trading strategies
Forecast for Q2'16 - levels for EUR/USD
Sergey Golubev, 2016.04.28 11:42
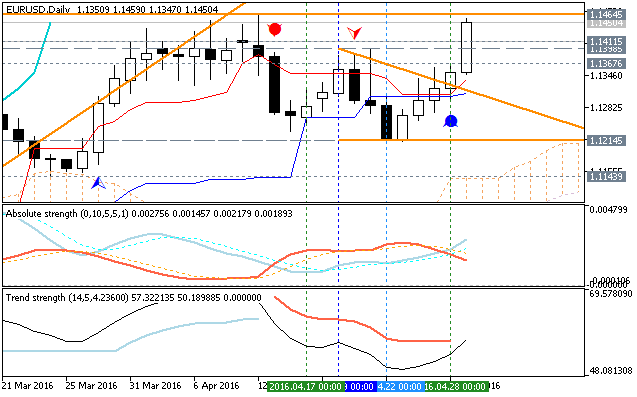
EURUSD Technical Analysis - bullish reversal breakout with 1.1367 target for the intra-day bullish trend to be continuing
H4 price is on breakout - the price broke Ichimoku cloud to above for the reversal from the primary bearish to the primary bullish market condition to be stopped near 1.1367 resistance level. Chinkou Span line broke the price to above for the bullish breakout to be continuing, Trend Strength indicator is estimating the bullish trend, and Absolute Strength indicator is estimating the ranging bullish market conditipon to be started in the near future.
If H4 price will break 1.1367 resistance level on close bar so the bullish trend will be continuing up to 1.1398 level as the nearest bullish target.
If not so the price will be ranging within the levels.
- Recommendation for long: watch close H4 price to break 1.1367 for possible buy trade
- Recommendation to go short: watch H4 price to break 1.1271 support level for possible sell trade
- Trading Summary: bullish
SUMMARY : bullishTREND : breakout
Forum on trading, automated trading systems and testing trading strategies
Forecast for Q2'16 - levels for SILVER (XAG/USD)
Sergey Golubev, 2016.04.28 18:18
SILVER (XAG/USD) Daily Price Action Analysis - ranging bullish with 50.0% Fibo support level at 16.23 to be broken for correction
D1 price is located above 200 period SMA (200 SMA) and above 100 period SMA (100 SMA) for the primary bullish market condition with the ranging within the follwing key support/resistance levels:
- Fibo resistance level at 17.68 located far above 100 SMA/200 SMA in the primary bullish area of the chart, and
- 50.0% Fibo support level at 16.23 located in the beginning of the secondary correction area.
RSI indicator is on overbought level estimating the secondary correction to be started in the future.If the price will break 50.0% Fibo support level at 16.23 so we may see the ranging correctional movement within the primary bullish market condition.

If the price will break Fibo resistance level at 17.68 from below to above so the primary bullish trend will be continuing with good possible breakout of the price movement.
If not so the price will be ranging within the levels.
SUMMARY : bullish
TREND : rangingForum on trading, automated trading systems and testing trading strategies
EURUSD Technical Analysis 2014
Sergey Golubev, 2014.07.26 09:47
I am using indicators for MT5 (because our forum is related to MT5) - go here to download:
---------------
Market conditionForum on trading, automated trading systems and testing trading strategies
Forecast for Q2'16 - levels for USD/CAD
Sergey Golubev, 2016.04.29 11:51
USD/CAD ahead of Canada's Gross Domestic Product (GDP)
2016-04-29 12:30 GMT | [CAD - GDP]
if actual > forecast (or previous one) = good for currency (for CAD in our case)
[CAD - GDP] = Change in the inflation-adjusted value of all goods and services produced by the economy.
==========
H4 intra-day price is on bearish market condition located to be below 200 period SMA (200 SMA) and 100 period SMA (100 SMA). The price is testing 1.1514 support level to below for the primary bearish trend to be continuing. Alternatively, if the price breaks 1.2605 resistance level to above so the local uptrend as the bear market rally will be started with 1.2857 bullish reversal level - if the price breaks this 1.2857 levels too so the reversal of the price movement from the primary bearish to the ranging bullish condition may be started.
USD/CAD M5. This timeframe may be more interesting as we are talking intra-day price movement about high impacted news event (Cadana's GDP) - as we know - the traders are using M5 timeframe to trade news events for example.
As we see from the chart - the price is below 100 SMA/200 SMA area for the bearish condition with the following key reversal support/resistance levels:
Anyway, the developing patterns (Retracement, AB=CD and 3-Drives) for timeframes started with M30 are estimating the uptrend so we will see about how the situation will be developed today for example:
USD/RUB (Russia) is at 5-month low: 64.15
GBP/USD (The UK) is at 3-month high: 1.4638
USD/JPY (Japan) is at 7-month low: 107.00
USD/CAD (Canada) is at 9-month low: 1.2504
NZD/USD (New Zealand) is at 10-month low: 0.6988
USD/TRY (Turkey) is at 8-month low: 2.8050
Bovespa Index (Brazil) is at 10-month high
Apple Shares is at 10-month low: 96.50
Brent Crude Oil is at 5-month high: 47.80
Forum on trading, automated trading systems and testing trading strategies
Gold is Reaching at 1270
Sergey Golubev, 2013.07.01 21:04
How can we know: correction, or bullish etc (in case of using indicator for example)?
well ... let's take AbsoluteStrength indicator from MT5 CodeBase.
bullish (Bull market) :
bearish (Bear market) :
ranging (choppy market - means: buy and sell on the same time) :
flat (sideways market - means: no buy and no sell) :
correction :
correction in a bear market (Bear Market Rally) :
Forum on trading, automated trading systems and testing trading strategies
Forecast for Q2'16 - levels for EUR/USD
Sergey Golubev, 2016.05.01 10:47
EURUSD Technical Analysis 2016, 01.05 - 08.05: daily bullish, weekly ranging bullish breakout, monthly bearish ranging within narrow levels
Daily price is on local primary bullish market condition for 1.1464 resistance level to be tested for the bullish trend to be continuing. Chinkou Span line and Absolute Strength indicator are estimating the bullish trend in the near future, and Trend Strength indicator is evaluating the future possible condition as the ranging bullish.
If D1 price will break 1.1214 support level on close bar so the reversal of the price movement from the primary bullish to the ranging bearish market condition will be started.
If D1 price will break 1.1464 resistance level on close bar from below to above so the primary bullish trend will be continuing.
If not so the price will be on ranging within the levels.
SUMMARY : bullish
TREND : breakoutForum on trading, automated trading systems and testing trading strategies
Forecast for Q2'16 - levels for S&P 500
Sergey Golubev, 2016.05.02 14:13
Quick Technical Overview - S&P 500: bullish ranging to the secondary correction
Daily price is on bullish market condition with above of 100-day SMA (100 SMA) and 200-day SMA (200 SMA):