You are missing trading opportunities:
- Free trading apps
- Over 8,000 signals for copying
- Economic news for exploring financial markets
Registration
Log in
You agree to website policy and terms of use
If you do not have an account, please register
If yes so it may be good for scalping, or for 'price action trading' in practics ... for example (I am talking with myself):
---------------
Q: Why do you think the price will go to uptrend for right now?
R: Because
- we see the the symmetric triangle pattern is going to be crossed by the price by above, and
- and we see Bulliush One White Soldier candlestick pattern for this 2 candle so the 3rd candle will go to uptrend just for sure by breaking key resistance level.
But I think - it may be valid for the next candle ... because for example - this one (Bullish One White Soldier) is for 2 candles, right? So, it may predict of the movement for the 3rd candle, and not for all the tendency concerning uptrend or downtrend, right?
If yes so it may be good for scalping, or for 'price action trading' in practics ... for example (I am talking with myself):
---------------
Q: Why do you think the price will go to uptrend for right now?
R: Because
- we see the the symmetric triangle pattern is going to be crossed by the price by above, and
- and we see Bulliush One White Soldier candlestick pattern for this 2 candle so the 3rd candle will go to uptrend just for sure by breaking key resistance level.
waw,,,good analysis bro,,,,
go Green Trade with Price Action
waw,,,good analysis bro,,,,
go Green Trade with Price Action
When the market is good to be more volatile so the candlestick patterns may help a lot in case of scalping during the high/medium impacted news events for example.
But this prediction is for the next candle only sorry ...
This is Bullish One White Soldier - it is exact one which you started this thread with your chart:
What does it mean?
It means that next candle will be the bullish one:
Forum on trading, automated trading systems and testing trading strategies
Something Interesting
Sergey Golubev, 2020.06.26 07:06
Hammer and Hanging Man Candlestick EA - expert for MetaTrader 5
Trading in two patterns: 'Hammer' (Hammer) and 'Hanging Man' (Hanged Man). Stop loss is floating and depends on the pattern found.
===========
Video with mini-articles
Forum on trading, automated trading systems and testing trading strategies
Something Interesting
Sergey Golubev, 2022.01.26 06:34
Hammer and Hanging Man Candlestick - indicator for MetaTrader 5
"The Hammer candlestick formation is a significant bullish reversal candlestick pattern that mainly occurs at the bottom of downtrends":
"The Inverted Hammer candlestick formation occurs mainly at the bottom of downtrends and is a warning of a potential reversal upward. It is important to note that the Inverted pattern is a warning of potential price change, not a signal, in and of itself, to buy".
"The Hanging Man candlestick formation, as one could predict from the name, is a bearish sign. This pattern occurs mainly at the top of uptrends and is a warning of a potential reversal downward. It is important to emphasize that the Hanging Man pattern is a warning of potential price change, not a signal, in and of itself, to go short".
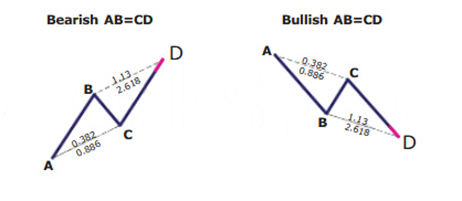
AB=CD.

Another projection of point D can be 1.270. The most optimal option is when the pulses of AB and CD are equal (or approximately equal) to each other. The best option is to look for the AB=CD pattern on pullbacks of the main trend.Which strategy is best for beginners and newcomers to practise and use in live trading?
None of the strategies are for beginners to trade live.
You have to master it first...and then you will not be a beginner anymore.