You are missing trading opportunities:
- Free trading apps
- Over 8,000 signals for copying
- Economic news for exploring financial markets
Registration
Log in
You agree to website policy and terms of use
If you do not have an account, please register
Free to Download for Metatrader 5
There are many Heiken Ashi indicators (and EA) on MT5 CodeBase, for example :
========
========
How To Trade - Heiken Ashi indicator and How Does It Work (adapted from the article)
Heikin-Ashi chart looks like the candlestick chart, but the method of calculation and plotting of the candles on the Heikin-Ashi chart is different from the candlestick chart. In candlestick charts, each candlestick shows four different prices: Open, Close, High and Low price.
But Heikin-Ashi candles are different and each candle is calculated and plotted using some information from the previous candle:
1- Open price: the open price in a Heikin-Ashi candle is the average of the open and close of the previous candle.
2- Close price: the close price in a Heikin-Ashi candle is the average of open, close, high and low prices.
3- High price: the high price in a Heikin-Ashi candle is chosen from one of the high, open and close price of which has the highest value.
4- Low price: the low price in a Heikin-Ashi candle is chosen from one of the low, open and close price of which has the lowest value.
So candles of a Heikin-Ashi chart are related to each other because the open price of each candle should be calculated using the previous candle close and open prices, and also the high and low price of each candle is affected by the previous candle. So a Heikin-Ashi chart is slower than a candlestick chart and its signals are delayed.
The Heikin-Ashi chart is delayed and the candlestick chart is much faster and helps us to make more profit. Why should we use a Heikin-Ashi chart then? As it was already explained, because of the delay that the Heikin-Ashi chart has, it has less number of false signals and prevent us from trading against the market. On the other hand, Heikin-Ashi candles are easier to read because unlike the candlesticks they don’t have too many different patterns.
Interesting article -
============
DiNapoli levels trading
Just like in life in the market everything is in continuous changing. Something which did perfrectly yesterday today appears not to show interesting results. However, there remain some fundamental strategies which experience some minor corrections over time, but do not change their ideological basis. One of them is “DiNapoli levels”, a strategy named after its founder. It represents stripped down realization of Fibonacci retracements.
This is interesting indicator (for MT5):
----------------

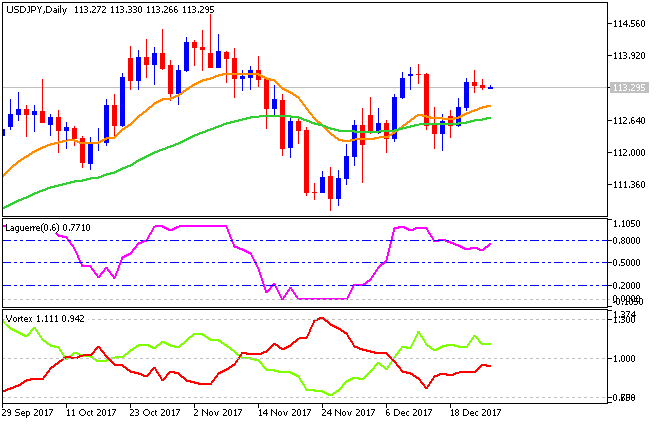
Vortex Oscillator - indicator for MetaTrader 5Oscillator based on Vortex indicator - displays the difference between lines VI + and VI- in the form of a histogram.
----------------
Vortex - indicator for MetaTrader 5
The indicator was described in the article "The Vortex Indicator" published in the January issue of "Technical Analysis of Stocks & Commodities" (2010).
Interesting article -
============
DiNapoli levels trading
Just like in life in the market everything is in continuous changing. Something which did perfrectly yesterday today appears not to show interesting results. However, there remain some fundamental strategies which experience some minor corrections over time, but do not change their ideological basis. One of them is “DiNapoli levels”, a strategy named after its founder. It represents stripped down realization of Fibonacci retracements.
Mr Sergey, this is very interesting, could it also be available for MT4 users?
As to the article so I did not see it for MT4.
But there are indicators for MT4 - use this link for search for example.
As to the article so I did not see it for MT4.
But there are indicators for MT4 - use this link for search for example.
Thanks
AscTrend
The beginning
After
============
PriceChannel Parabolic system
The beginning - Channel systems
PriceChannel Parabolic system basic edition
PriceChannel Parabolic system second edition
Latest version of the system with latest EAs to download
How to trade
The setting for EAs: optimization and backtesting
Trading examples
Metaquotes demo
GoMarkets broker, initial deposit is 1,000
Alpari UK broker initial deposit is 1,000
RoboForex broker initial deposit is 1,000
Just about drawdown -
Forum on trading, automated trading systems and testing trading strategies
Is Relative DrawDown terminology identical to Absolute Draw Down ?
Michele Lazzarini, 2014.08.09 02:16
Absolute: compared to initial balance
Maximal: largest drawdown (measured in currency)
Relative: largest relative drawdown (measured in %)
This because you can have an early drawdown big in % but not in currency.
The Maximal can hide a largest drawdown in % happened earlier.
Relative is an index of resistance to drawdowns and can be used to compare different results.
- - - - - - - - - - - - - - - - - - - - - - - - - - - - - - - - - - - - - - - - -
To assess performances i find useful this expression:
Efficacy = Net Profit / Gross Profit
this can be used combined with Relative Drawdown, to assess the real reliability of a strategy:
Reliability = Efficacy / Relative Drawdown
Forum on trading, automated trading systems and testing trading strategies
Maximum Drawdown
Sergey Golubev, 2016.09.28 08:20
This is what I found:
...
There are many 'drawdowns' in the world:
I am not sure which kind of drawdown is used for the signals (I think, it may be 'Maximum drawdown on equity open trades' as maximum possibe drawdown) but you can read the following:
Article: What the Numbers in the Expert Testing Report Mean
Small thread: Is Relative DrawDown terminology identical to Absolute Draw Down ?
Templates to create EAs and Indicators - MT4
The forum
The articles
CodeBase
============
Templates to create EAs and Indicators - MT5
The forum
N/A
The Articles
CodeBase