Example
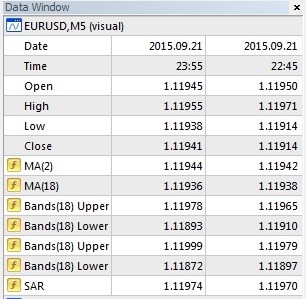
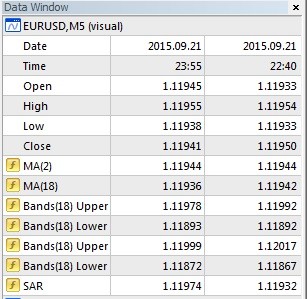
In the data window for EURUSD 21/09/2015 @ 22:45 I get

From my test file I'm getting the following results.
0 18:28:48 2015.09.21 22:45 TestSAR EURUSD,M5: OnTick::m1Sar_M0 = 1.11932000
0 18:28:48 2015.09.21 22:45 TestSAR EURUSD,M5: OnTick::m1Sar_M1 = 1.11931708
0 18:28:48 2015.09.21 22:45 TestSAR EURUSD,M5: OnTick::m1Sar_M2 = 1.11924950
0 18:28:48 2015.09.21 22:45 TestSAR EURUSD,M5: OnTick::m1CSar_M0 = 1.11932000
0 18:28:48 2015.09.21 22:45 TestSAR EURUSD,M5: OnTick::m1CSar_M1 = 1.11931708
0 18:28:48 2015.09.21 22:45 TestSAR EURUSD,M5: OnTick::m1CSar_M2 = 1.11924950
where m1Sar_Mx is the iSAR(NULL,PERIOD_M5,0.15,0.2,0); command
and m1CSar_Mx is the iCustom(NULL,PERIOD_M5,"Parabolic",0.15,0.2,0,0); command.
Where as I see the value 1.11932 from the previous bar, here's the DataWindow

- Free trading apps
- Over 8,000 signals for copying
- Economic news for exploring financial markets
You agree to website policy and terms of use
Hi,
I notice that the Parabolic SAR indicator always displays the correct SAR value for the current bar.
However, with iSAR function, shift 0, or with the iCustom of the Parabolic SAR indicator, shift 0, the value is always the previous bar.
What I would like to know is how to calculate (in real time) the SAR value for the current bar just like the Parabolic SAR indicator does.
Could someone show me the calculation that I need to do.
Thanks in advance.