CCI Indicator - from a line to a Histogram
Greetings - how do I change a CCI set at (14) to a Histogram? My levels will be (50, -50) for overbought/oversold. Id like to be able to color the Histogram bars to indicate the overbought and oversold conditions as well. It's easy to do on Tradestation...not offered on Meta.
- MACD - Oscillators - Indicators - Charts - MetaTrader 5 for Android
- MACD - Oscillators - Indicators - Chart - MetaTrader 5 for iPhone
- MACD - Oscillators - Technical Indicators - Price Charts, Technical and Fundamental Analysis
mongo :
Greetings - how do I change a CCI set at (14) to a Histogram? My levels will be (50, -50) for overbought/oversold. Id like to be able to color the Histogram bars to indicate the overbought and oversold conditions as well. It's easy to do on Tradestation...not offered on Meta.
Greetings - how do I change a CCI set at (14) to a Histogram? My levels will be (50, -50) for overbought/oversold. Id like to be able to color the Histogram bars to indicate the overbought and oversold conditions as well. It's easy to do on Tradestation...not offered on Meta.
here's the screenshot of the CCI as a Histogram.
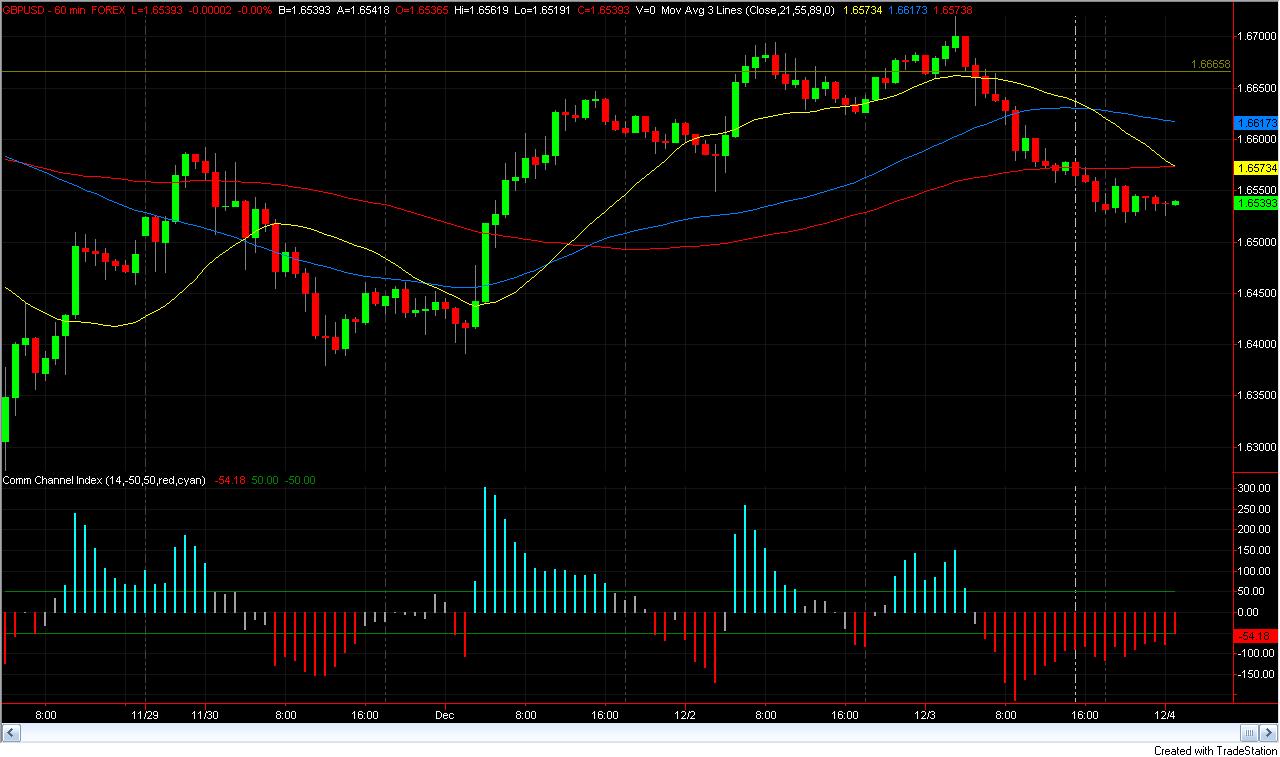
sorry, new to posting images...take three. Histogram attached. The Blue indicating overbought, Red oversold. The (2) Green lines are my 50, -50 levels. Thx for the assistance. Mongo
You are missing trading opportunities:
- Free trading apps
- Over 8,000 signals for copying
- Economic news for exploring financial markets
Registration
Log in
You agree to website policy and terms of use
If you do not have an account, please register