The Stochastic RSI combines two very popular technical analysis indicators, Stochastics and the Relative Strength Index (RSI). Whereas Stochastics and RSI are based off of price, Stochastic RSI derives its values from the Relative Strength Index (RSI); it is basically the Stochastic indicator applied to the RSI indicator.
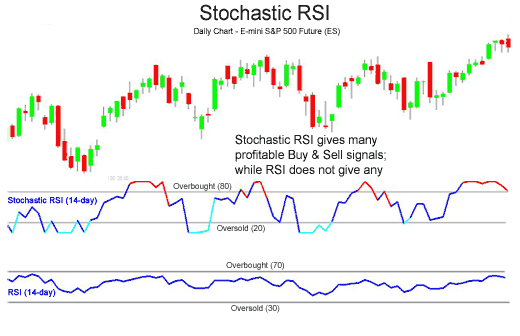
As will be shown below in the chart of the S&P 500 E-mini Futures contract, the Stochastic RSI gives more profitable buy and sell signals and overbought and oversold readings, than the Relative Strength Index:

In the chart above of the E-mini S&P 500 Futures contract, the RSI indicator spent most of its time between overbought (70) and oversold (30), giving no buy or sell signals. However, the Stochastic RSI used the RSI indicator to uncover many profitable buy and sell signals.
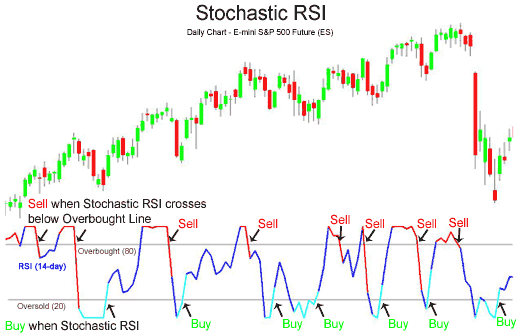
How to interpret the buy and sell signals of the Stochastic RSI is given next in the chart of the S&P 500 E-mini:

Buy when the Stochastic RSI crosses above the Oversold Line (20).
Stochastic RSI Sell Signal
Sell when the Stochastic RSI crosses below the Overbought Line (80).
is there such an indicator for mt4?
The Stochastic RSI combines two very popular technical analysis indicators, Stochastics and the Relative Strength Index (RSI). Whereas Stochastics and RSI are based off of price, Stochastic RSI derives its values from the Relative Strength Index (RSI); it is basically the Stochastic indicator applied to the RSI indicator.
As will be shown below in the chart of the S&P 500 E-mini Futures contract, the Stochastic RSI gives more profitable buy and sell signals and overbought and oversold readings, than the Relative Strength Index:
In the chart above of the E-mini S&P 500 Futures contract, the RSI indicator spent most of its time between overbought (70) and oversold (30), giving no buy or sell signals. However, the Stochastic RSI used the RSI indicator to uncover many profitable buy and sell signals.
How to interpret the buy and sell signals of the Stochastic RSI is given next in the chart of the S&P 500 E-mini:
Buy when the Stochastic RSI crosses above the Oversold Line (20).
Stochastic RSI Sell Signal
Sell when the Stochastic RSI crosses below the Overbought Line (80).
Hi,
Do you perhaps have the StochasticRSI indicator in MT4 format? It would be appreciated if you could provide it in MT4 format please.
Thanks in advance.
Forum on trading, automated trading systems and testing trading strategies
Error 145 Trade Server Return Code
angevoyageur, 2014.03.01 14:27
Hello,
This forum is about MT5/mql5, please post your question about MT4/mql4 on mql4.com forum.
- They are more people who can answer there.
- They are more people who can have similar problem there.
- A forum is not only to get help but to share with the community, mql4/MT4 community isn't the same as mql5/MT5 community.
I am trying to run the RSI but getting errors the "case value already used" as below.
}
getting the errors from these lines
'Method' - comma expected smoothalgorithms.mqh 537
'{' - function definition unexpected smoothalgorithms.mqh 538
'return' - expressions are not allowed on a global scope smoothalgorithms.mqh 554
'}' - expressions are not allowed on a global scope smoothalgorithms.mqh 555
- Free trading apps
- Over 8,000 signals for copying
- Economic news for exploring financial markets
You agree to website policy and terms of use
Stochastic RSI:
Stochastic RSI is a standard Stochastic oscillator, the values of which are calculated not from a price series but from RSI technical indicator values.
Standard RSI may not show market cycles or volatility changes. In case the market enters trend state, RSI often is not able to reach the appropriate level that can trigger position opening signal according to the trend direction. Implementation of Stochastic oscillator to RSI creates a dynamic indicator that better corresponds to its current volatility.
Author: Nikolay Kositsin