Discussing the article: "Statistical Arbitrage Through Mean Reversion in Pairs Trading: Beating the Market by Math"
I don't get your approach and code. Since you use 5 second timer and updates of the quote array, why do you use CopyClose for _Period initially? You can't compare and handle in the same array - 5 second intervals and any standard timeframes (even M1).
After inital CopyClose you have an array of quotes with the order from most outdated (0-th) to most recent (n-1-th) elements.
Then you update (by timer) the array by removing the last (most recent) element and inserting a single new close value at 0-th index (where most outdated element is stored).
You did not ever shift the array of quotes on the events of new bar formations, that is your arrays are by 5 seconds intervals, yet one of the modes compare this values with MAs over _Period. That's again a big inconsistency.
Also if you're going to use bars finally (your intentions are unclear so far), make sure you synchronize bars of different symbols by timestamps.
Thank you for taking the time to check the code.
The 5 sec intervals are arbitrary at this point. It could be 1 sec or 10 sec. The idea is to have an initial window to calculate the mean spread and, eventually, other stats for the period covered by the CountQuotes. Then keep updating a moving window at X sec intervals no matter the timeframe.
You are right about the bars: I'm not interested in them or in keeping them synchronized because it seems to me that they are irrelevant in this specific case. Almost all trades last for a couple of seconds, opening and closing intrabar.
That said, what do you think about this approach? Is it more clear now? Do you see any critical flaw that can lead to wrong calculations, affect the performance, or anything?
I really appreciate your comment and I'm looking forward to more. This code will evolve here, in public, and you already gave me food for thought. :)
Have a nice weekend.
Dear friends, I made a mistake when I uploaded the Tester configuration file (*.ini settings). Obviously, the backtest should run with ZERO TP/SL, that is, the positions should be closed when the spread "returns to the mean", not by stop-loss or take-profit.
To correctly reproduce the backtest reported in the article, please use the configuration file attached here.
I apologize for any inconvenience that this mistake may have caused to you.
Thank you so much for sharing, got busy all day working on your material, very interesting. Some tweaks here and there... oh and added a couple of filters.
Some charts for last 3 months
EURUSD
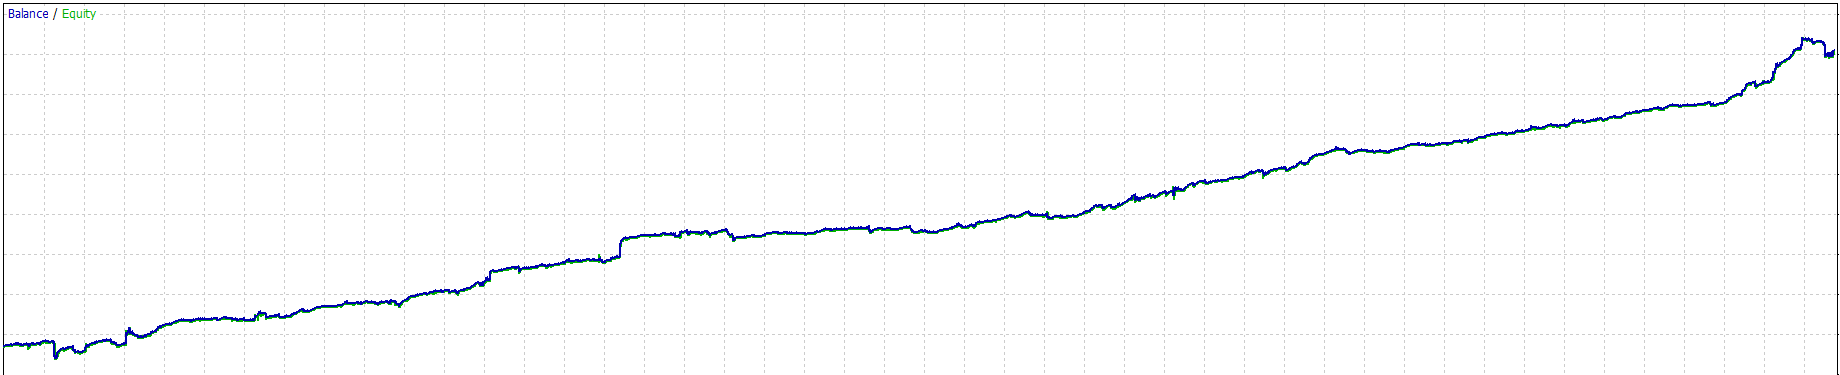
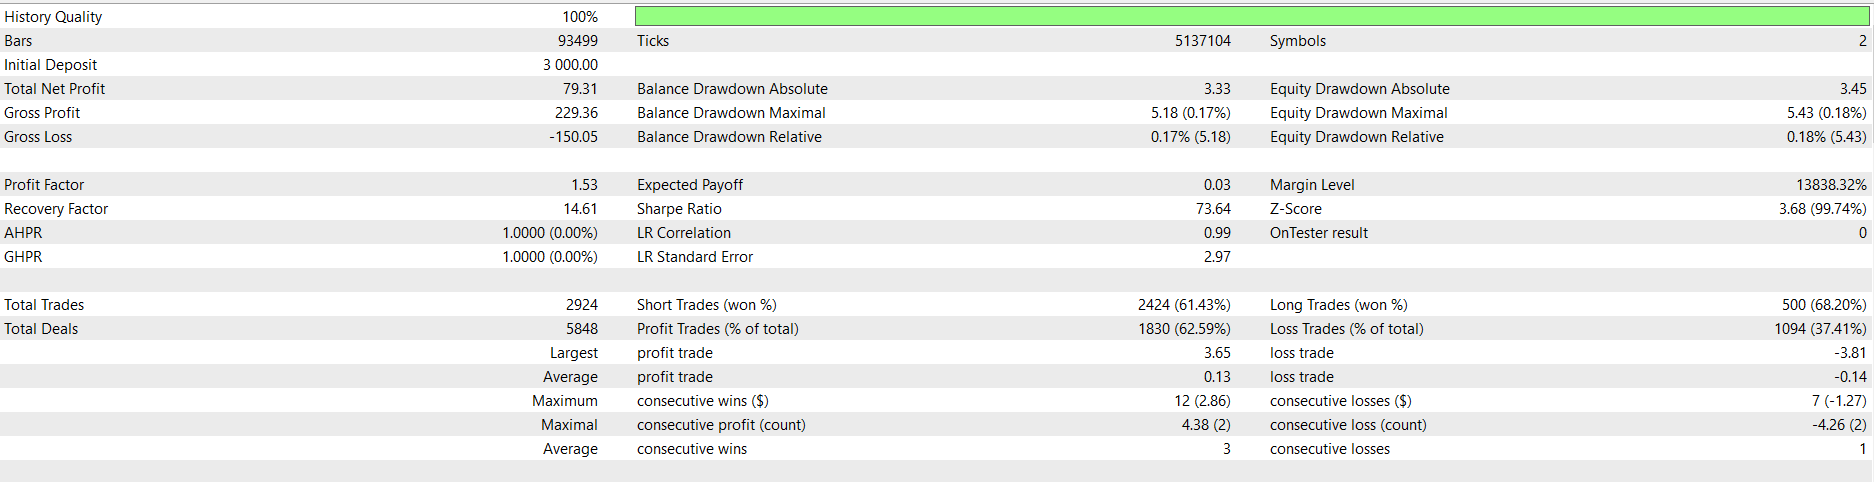
XAUUSD
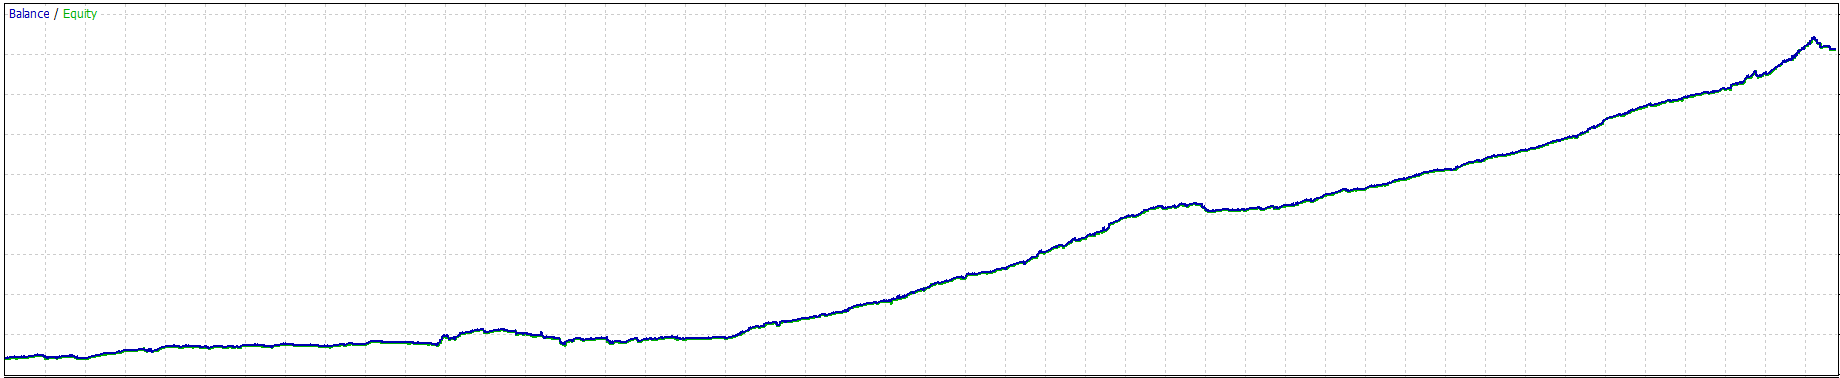
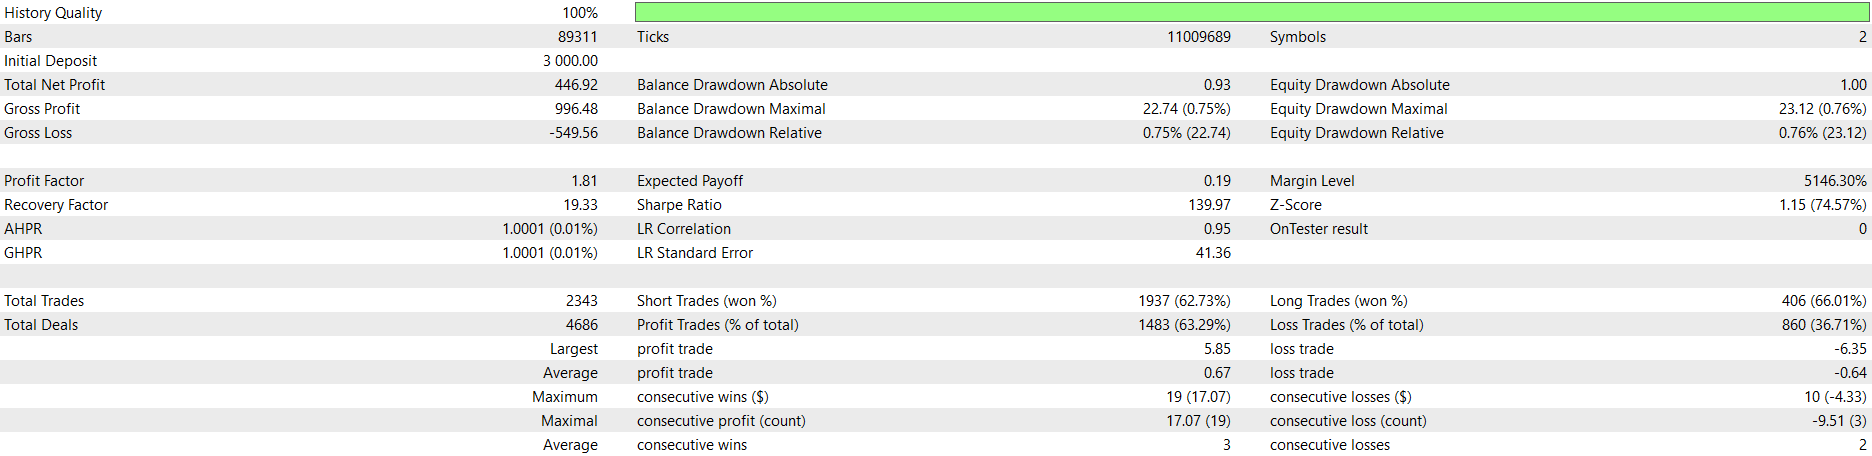
You are doing great work, cheers!
Thank you so much for sharing, got busy all day working on your material, very interesting. Some tweaks here and there... oh and added a couple of filters.
Some charts for last 3 months
EURUSD
XAUUSD
You are doing great work, cheers!
I'm glad you are checking it, Eric.
Just one thing to note: be careful if/when running in real account. Slippage and big players frontrunning your orders can lead to losses.
Good luck, happy trading!
- Free trading apps
- Over 8,000 signals for copying
- Economic news for exploring financial markets
You agree to website policy and terms of use
Check out the new article: Statistical Arbitrage Through Mean Reversion in Pairs Trading: Beating the Market by Math.
This article describes the fundamentals of portfolio-level statistical arbitrage. Its goal is to facilitate the understanding of the principles of statistical arbitrage to readers without deep math knowledge and propose a starting point conceptual framework. The article includes a working Expert Advisor, some notes about its one-year backtest, and the respective backtest configuration settings (.ini file) for the reproduction of the experiment.
This article is by no means an attempt to reproduce, or worse, “to reveal the secret code” of RenTech/Jim Simons. As said above, that would be impossible for anyone not directly involved in their operations. It is an effort to share with you my understanding of the general principles that power their models. These principles can inform the trading system of even the most humble retail trader. The difference will be in the scale of the results, which will be proportional to the amount of resources invested in the system and operations.
So, what you will read below is the result of research in books, video documentaries, and specialized internet communities, merged with my personal experience of a few years in the finance segment (more on the business side than on the developer side). What RenTech runs is huge, but what we will see here is a miniature, let’s say, an action figure of a superhero, a scale model of a skyscraper.
The goal is to contribute with a low-cost, lightweight, and easy-to-develop method of analysis that can be tested and improved by the average retail trader using only the tools already available in the MetaTrader 5 platform running on a commodity consumer notebook, possibly a low-end notebook. The method should be useful to the algorithmic trader, and to the discretionary trader as well. We will start with the most straightforward setup, just enough to describe the process.
After understanding the general concepts behind the model, we will build a minimal portfolio for the most simple form of statistical arbitrage, trade it in automated mode with an Expert Advisor, take some notes about the results, and finally think about the required next steps. I hope that this experience can help you to get started with this powerful trading technique and to be able to expand this knowledge later, bringing other symbols to the portfolio and testing other algorithms beyond the one described here, to progressively build your own full-featured StatArb strategy adequate to your resources and objectives.
Author: Jocimar Lopes