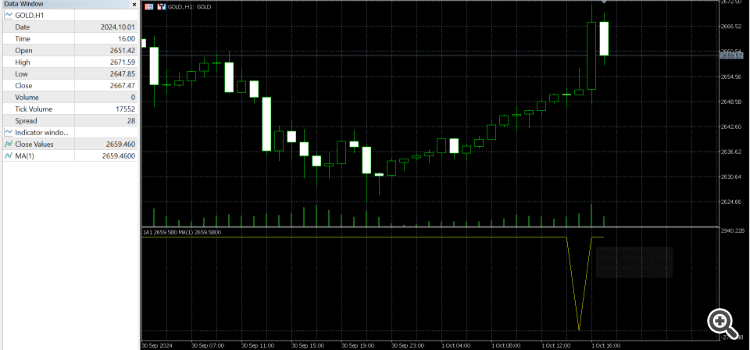
How to create line every tick at mql5 indicator. Shifting the values of the buffers from one candle to another
Your topic has been moved to the section: Technical Indicators
Please consider which section is most appropriate — https://www.mql5.com/en/forum/172166/page6#comment_49114893
Please consider which section is most appropriate — https://www.mql5.com/en/forum/172166/page6#comment_49114893
Fernando Carreiro #:
Your topic has been moved to the section: Technical Indicators
Please consider which section is most appropriate — https://www.mql5.com/en/forum/172166/page6#comment_49114893
Your topic has been moved to the section: Technical Indicators
Please consider which section is most appropriate — https://www.mql5.com/en/forum/172166/page6#comment_49114893
Thank you
can you help me in that topic?
I need help about this topic
Can a new line be drawn in candle -1? I mean, can a new line be drawn whenever the price moves regardless of the time like the Renko idea?
After reviewing the problem, it turned out that whenever the price moves by a tick, instead of drawing a moving average with a close value of candle 0, it draws a moving average with the same value as the move.
You are missing trading opportunities:
- Free trading apps
- Over 8,000 signals for copying
- Economic news for exploring financial markets
Registration
Log in
You agree to website policy and terms of use
If you do not have an account, please register


Hello
The indicator only reads the value for candle 0 and the value for candle 1 only
If I change this line:
And make it :
The data for the indicator values becomes completely wrong
My question is how do I make the indicator receive data other than the data for the current candle and the previous candle?
Or what leads to my inability to increase the number of updated candles?
The purpose of the indicator is to draw a line when the price moves either up or down and updates the values
for example:
It draws the line at the close level of the current candle
And if a new movement occurs, it draws a new line with the new price on the current candle and then transfers the previous value to the previous candle
It does that well with only two candles, but what I want is for it to do that with more than two candles without changing the output values
Waiting for your solutions