Programmatically equaling time on chart?
The X-axis is quantized by chosen time frame. For example in a H1 time frame you do not have 09:15.
Anywhere except those quantized points there is no valid data per trend line. Unless the trend lines are too large you get totally inaccurate results. If you choose a non-existing point on chart it rounds to nearest existing point which can be very different from what you expect.
Greetings,
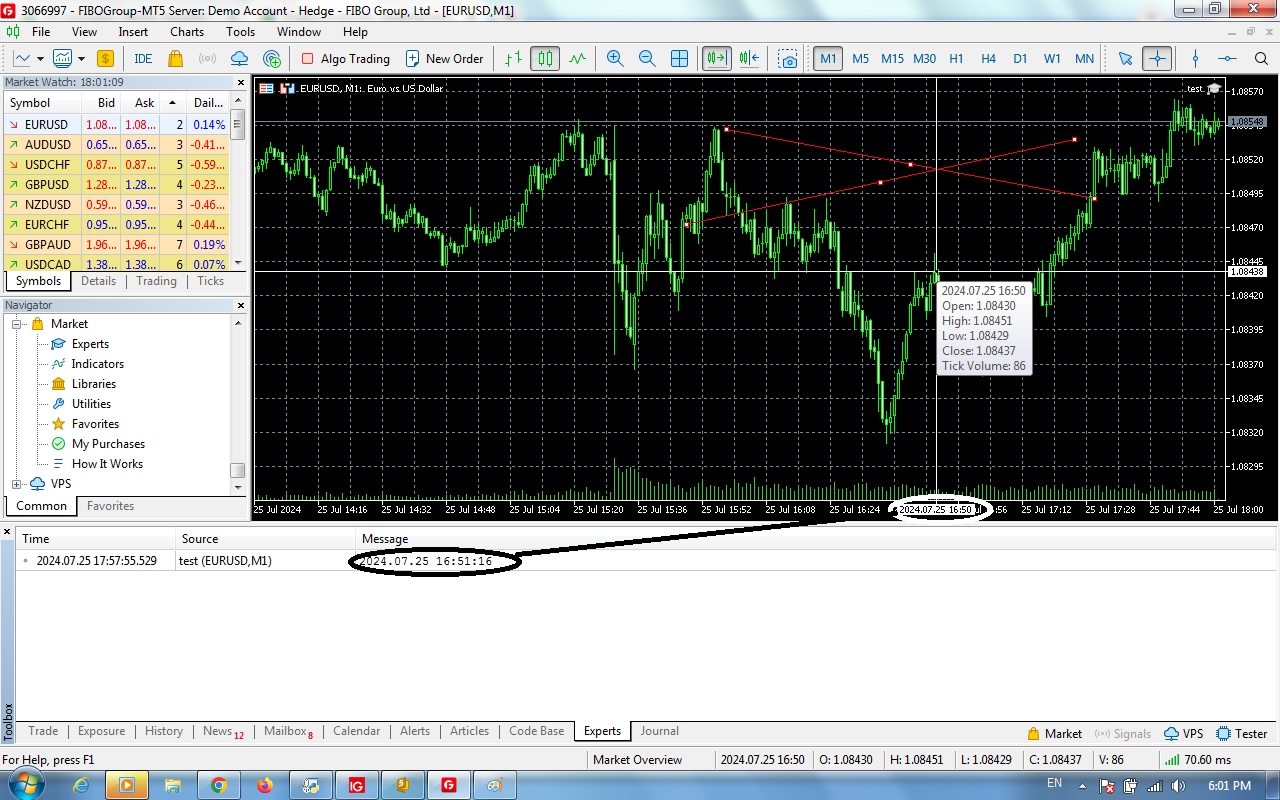
Below I have a function intended to determine the intersection of 2 ('Object Trend') lines drawn on a chart. The issue is that the 'intersection time' being reported does not seem to equal what I am seeing visually on the chart. In the function the 'time' of the intersection is set as the variable for "x", while the 'price' at the intersection is set as the variable for "y". The 'intersection time' is set as the variable "intersectionTime". This problem might possibly be caused by some conversion error involving 'double' and 'datetime' variables in the MQL5 language...however I'm not exactly sure. There also appear to be issues involving the comparison of "intersectionTime" and "lastTime" (is a direct comparison as I have written it possible in MQL5?) and possibly the display of the "y" variable for price. Any suggestions greatly appreciated.
I thank you in advance for any assistance.
Thank you for the replies,
So I should use the 'iBarShift' to convert 'intersectionTime' to the index of the bar corresponding to the specified time? On a 'Daily' chart that might still be inaccurate, I would think...since the intersection time and price should be more precise than just a bar index.
Can the results of my calculations ('x' and 'y') in the example I provided be an considered accurate plot of intersection, or is it dependent upon the time period on the chart?
This MQL5 language is extremely frustrating, is there any example someplace of code that will find line intersections and correctly log X and Y coordinates, and/or plot graphical objects on the chart AT THE POINT OF THE INTERSECTION accurately? Thank you in advance.
Regards
In your code (x1, x2) can be non-existent points on chart. Better to round them to existing ones in M1 time frame. Then find the intersection (what your code is doing is fine about this).
//round x1 and x2 to closest existing M1 bar on chart
x1=iTime(_Symbol, PERIOD_M1, iBarShift(_Symbol, PERIOD_M1, x1, false));
x2=iTime(_Symbol, PERIOD_M1, iBarShift(_Symbol, PERIOD_M1, x2, false));
//Now call your function
bool DoLinesIntersect(x1, y1, x2, y2... )
Thanks for the reply Yashar,
So I should revise my computations before calling the "DoLinesIntersect" function? I had previously been passing information similar to the following:
            double xA1 = (double)ObjectGetInteger(0, "TopOpen_" + IntegerToString(bar1), OBJPROP_TIME, 0);
            double yA1 = ObjectGetDouble(0, "TopOpen_" + IntegerToString(bar1), OBJPROP_PRICE, 0);
            double xA2 = (double)ObjectGetInteger(0, "TopOpen_" + IntegerToString(bar1), OBJPROP_TIME, 1);
            double yA2 = ObjectGetDouble(0, "TopOpen_" + IntegerToString(bar1), OBJPROP_PRICE, 1);

            (DoLinesIntersect(xA1, yA1, xA2, yA2, ...)
And instead I should modify as you posted so as to return the closest bar on the minute chart...? As so:
           //round x1 and x2 to closest existing M1 bar on chart
           x1=iTime(_Symbol, PERIOD_M1, iBarShift(_Symbol, PERIOD_M1, xA1, false));
           x2=iTime(_Symbol, PERIOD_M1, iBarShift(_Symbol, PERIOD_M1, xA2, false));
And this is done for the purpose of establishing the most accurate intersection return (as rounded to the minute) regardless of the chart timeframe used? Thank you again.
Regards
Thanks Yashar I will attempt your idea later when I have the opportunity. I will see about converting the starting and ending points of the object lines into M1 calculations, thanks for your input (and to Dominik as well).
Regards
//+------------------------------------------------------------------+
//|                                                                  |
//+------------------------------------------------------------------+
int OnInit()
  {

   long x1 = ObjectGetInteger(ChartID(), "TREND1", OBJPROP_TIME, 0);
   long x2 = ObjectGetInteger(ChartID(), "TREND1", OBJPROP_TIME, 1);
   long x3 = ObjectGetInteger(ChartID(), "TREND2", OBJPROP_TIME, 0);
   long x4 = ObjectGetInteger(ChartID(), "TREND2", OBJPROP_TIME, 1);

   double y1 = ObjectGetDouble(ChartID(), "TREND1", OBJPROP_PRICE, 0);
   double y2 = ObjectGetDouble(ChartID(), "TREND1", OBJPROP_PRICE, 1);
   double y3 = ObjectGetDouble(ChartID(), "TREND2", OBJPROP_PRICE, 0);
   double y4 = ObjectGetDouble(ChartID(), "TREND2", OBJPROP_PRICE, 1);


   double m1 = (y2 - y1) / (x2 - x1);
   double m2 = (y4 - y3) / (x4 - x3);

   if(m1 != m2)
     {
      double x = (-m2 * x3 + y3 + m1 * x1 - y1) / (m1 - m2);
      double y = m1 * (x - x1) + y1;
      datetime intersectionTime = (datetime)x;
      Print(intersectionTime);
     }
   return(INIT_SUCCEEDED);
  }
//+------------------------------------------------------------------+
- Free trading apps
- Over 8,000 signals for copying
- Economic news for exploring financial markets
You agree to website policy and terms of use
Greetings,
Below I have a function intended to determine the intersection of 2 ('Object Trend') lines drawn on a chart. The issue is that the 'intersection time' being reported does not seem to equal what I am seeing visually on the chart. In the function the 'time' of the intersection is set as the variable for "x", while the 'price' at the intersection is set as the variable for "y". The 'intersection time' is set as the variable "intersectionTime". This problem might possibly be caused by some conversion error involving 'double' and 'datetime' variables in the MQL5 language...however I'm not exactly sure. There also appear to be issues involving the comparison of "intersectionTime" and "lastTime" (is a direct comparison as I have written it possible in MQL5?) and possibly the display of the "y" variable for price. Any suggestions greatly appreciated.
I thank you in advance for any assistance.