Discussing the article: "Using PatchTST Machine Learning Algorithm for Predicting Next 24 Hours of Price Action"
Hi, can you explain better what those bars are that I see in MT5? ok they have two colors green and red but what do they indicate? Thanks
The green and the red bars are generated from this code snippet:
ObjectSetInteger(0, obj_name, OBJPROP_COLOR, close > open ? clrGreen : clrRed);
So green means that model thinks that close will be higher than open (much like a green bar on a candle stick chart), in the future at that time. Red means close will be lower than open for that hour in the future.
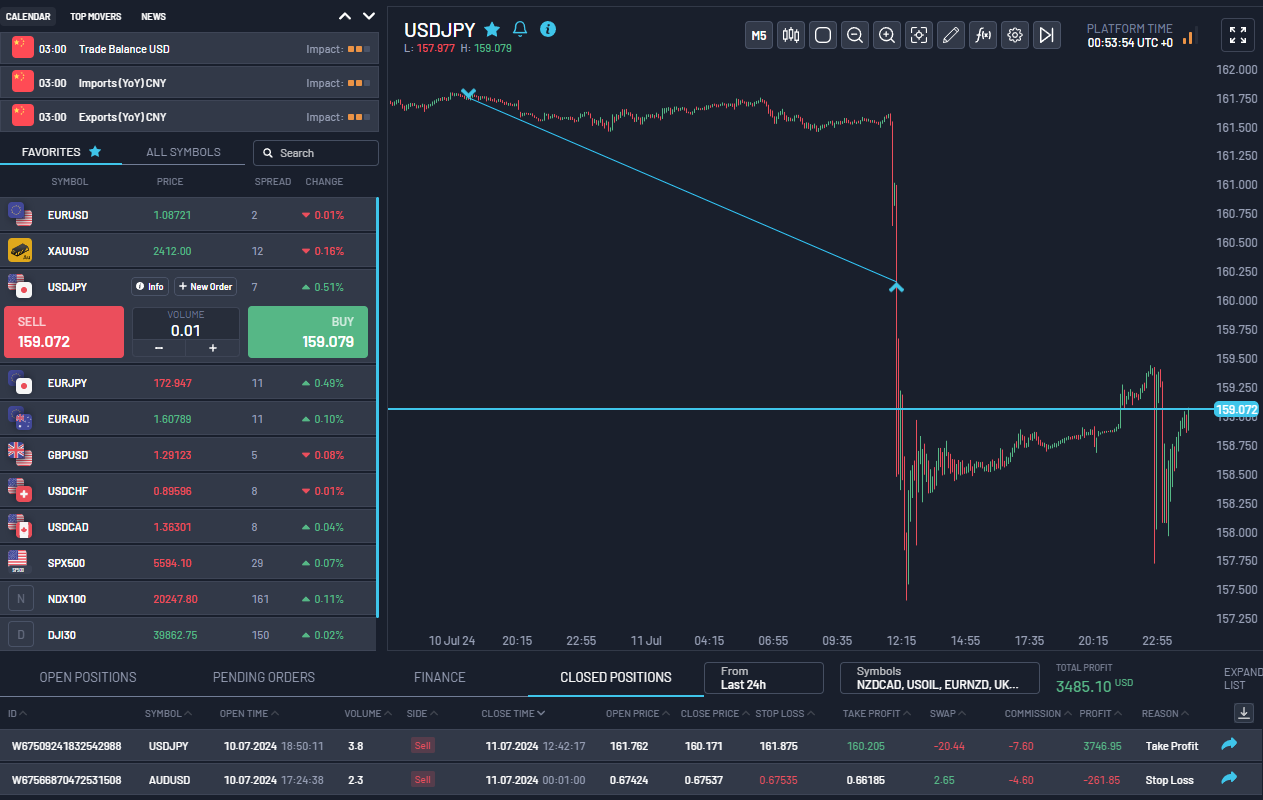
Like for example, I trained the model for a few other pairs yesterday. I used the indicator that I show in the chart but the ONNX model was trained for USDJPY and AUDUSD. I caught a 15R trade this morning based on the model's prediction for USDJPY. I wasn't even watching the charts really while all this happened. I just took the trade in the afternoon after completing the training and let the position run overnight (I paid the swap). In my experience, so far, what I have been able to discern is that you can generally trust the direction that the model is predicting. Also note any patterns you may see, so for example, more consecutive red bars on the chart would indicate that the model thinks price will go down. More green bars would indicate that model thinks the price will go up.
As you can see, I also lost about 1R for AUDUSD based on the model prediction, so it's not perfect. You still have to use your other skills like supply and demand zones for setting SL and TP, macro fundamentals, positing sizing, and risk management etc. In my opinion, using trained PatchTST models will give you a lot more precision and confidence in placing those trades at the right hour of the day or in the right session at least (Asia, London, or NY). The screenshot below is from a prop-firm evaluation that I am working on at the moment.
- Free trading apps
- Over 8,000 signals for copying
- Economic news for exploring financial markets
You agree to website policy and terms of use
Check out the new article: Using PatchTST Machine Learning Algorithm for Predicting Next 24 Hours of Price Action.
In this article, we apply a relatively complex neural network algorithm released in 2023 called PatchTST for predicting the price action for the next 24 hours. We will use the official repository, make slight modifications, train a model for EURUSD, and apply it to making future predictions both in Python and MQL5.
I first encountered an algorithm called PatchTST when I started to dig into the AI advancements associated with time series predictions on Huggingface.co. As anyone who has worked with large language models (LLMs) would know, the invention of transformers has been a game changer for developing tools for natural language, image, and video processing. But what about time series? Is it something that's just left behind? Or is most of the research simply behind closed doors? It turns out there are many newer models that apply transformers successfully for predicting time series. In this article, we will look at one such implementation.
What's impressive about PatchTST is how quick it is to train a model and how easy it is to use the trained model with MQL. I admit openly that I am new to the concept of neural networks. But going through this process and tackling the implementation of PatchTST outlined in this article for MQL5, I felt like I took a giant leap forward in my learning and understanding of how these complex neural networks are developed, troubleshot, trained, and used. It is like taking a child, who is barely learning to walk, and putting him on a professional soccer team, expecting him to score the winning goal in the World Cup final.
Author: Shashank Rai