How HHHL LLLC works ?
Hi everyone
could Anyone explain How HHHL LLLC works ?
.
Sorry little mistake
It´t HHHC LLLC =
"Higher High and Higher Close" and "Lower Low Lower Close"
ChatGPT response (used automatic translation from the original Portuguese text):
The "HHHC LLLC" standard is an acronym for "Higher High Higher Close" and "Lower Low Lower Close." Let's detail each of them:
Higher High Higher Close (HHHC)
- Higher High: The price reaches a higher point compared to the previous high point.
- Higher Close: The price close is higher than the previous close.
Interpretation
This pattern is used to identify an uptrend. When an asset is in an uptrend, it is common to see new peaks that are higher than previous ones and price closes that are also higher. This indicates strong buying pressure and could be a signal to enter a long (buy) position.
Lower Low Lower Close (LLLC)
- Lower Low: The price reaches a lower point compared to the previous lowest point.
- Lower Close: The price close is lower than the previous close.
Interpretation
This pattern is used to identify a downtrend. When an asset is in a downtrend, it is common to see new bottoms that are lower than previous ones and price closes that are also lower. This indicates strong selling pressure and may be a signal to enter a short (sell) position.
Use in Trading
- Trend Confirmation: Both patterns help confirm the current market trend direction.
- Entry and Exit: Traders can use these patterns to determine entry and exit points. For example, in an uptrend, after identifying an HHHC, a trader may decide to buy in the expectation that the price will continue to rise.
- Risk Management: Combined with other technical analysis tools, these patterns can help with risk management by setting appropriate stops based on identified highs and lows.
Practical examples
- HHHC: Suppose the price of a share rises from 50 to 55 and closes at 53 (Higher High). The next day, the price reaches 58 and closes at 56 (Higher Close). This sets up an HHHC pattern.
- LLLC: Suppose the price of a stock falls from 50 to 45 and closes at 47 (Lower Low). The next day, the price drops to 42 and closes at 43 (Lower Close). This sets up an LLC standard.
These patterns are often used in conjunction with other technical analysis tools such as moving averages, trend lines and indicators such as the RSI (Relative Strength Index) to increase the accuracy of trading decisions.
 It works very well.
 HHHC= High is above the high of previous candle & Close is above the close of previous candle
LLLC = Low is below the low of previous candle & Close is below the close of previous candle
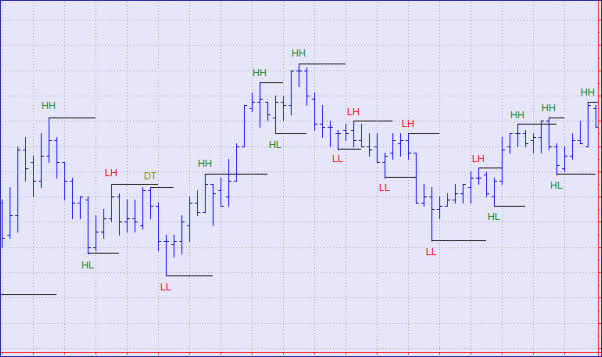
basically this is the corfirmation by candle sticks ,the earliest confirmation we can get .Multiple timeframe analysis via this strategy is awsome as in the image above
Stop using ChatGPT/Copilot.
Help needed to debug and fix an AI EA - Trading Systems - MQL5 programming forum #2 (2023)
It works very well.
HHHC= High is above the high of previous candle & Close is above the close of previous candle
LLLC = Low is below the low of previous candle & Close is below the close of previous candle
basically this is the corfirmation by candle sticks ,the earliest confirmation we can get .Multiple timeframe analysis via this strategy is awsome as in the image above
TKS Adnan
Is there any strategy material aboult HHHC LLLC ?
- Free trading apps
- Over 8,000 signals for copying
- Economic news for exploring financial markets
You agree to website policy and terms of use
could Anyone explain How HHHL LLLC works ?