Discussing the article: "DRAW_ARROW drawing type in multi-symbol multi-period indicators"
A fractal cannot be fast or slow in principle :)
Until two bars from the top are formed - there is no fractal, or rather there is something, but it is not a fractal
Artem, I have inserted your panel into the Expert Advisor, what should I do to make it work in the tester for visual testing?
For example, your Expert Advisor from the previous articles TestTrendADX, if you run it on visual, the data is displayed only after initialisation, then nothing is displayed.
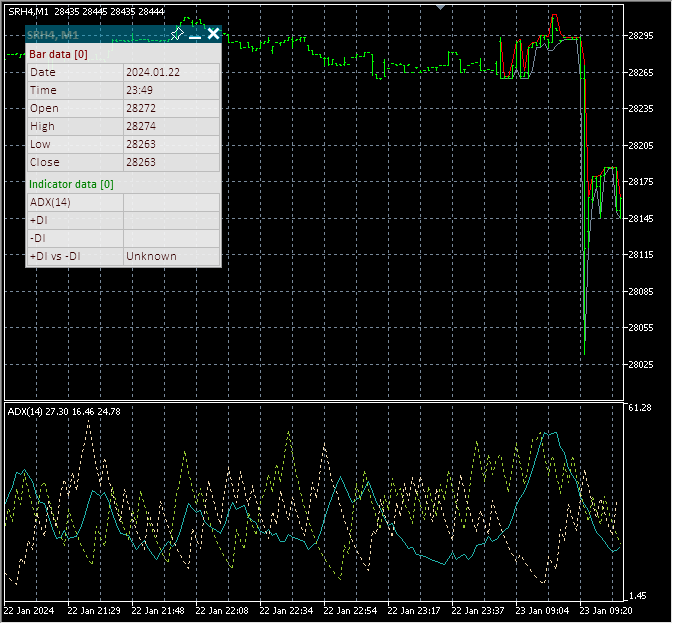
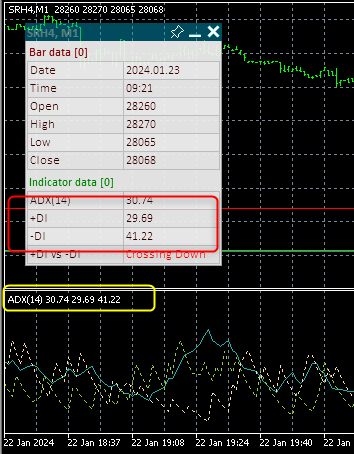
If you do it like this, the data of the current bar and the indicator data start to be displayed
//+------------------------------------------------------------------+
//| Expert tick function                                             |
//+------------------------------------------------------------------+
void OnTick()
  {
//---
//--- Выводим на панель данные текущего бара
   DrawData(0,TimeCurrent());
  }
But I don't know whether I do it correctly or not.
Well, for example, your Expert Advisor from the previous articles TestTrendADX, if you run it on visual, the data is displayed only after initialisation, then nothing is displayed.
If you do it like this, the data of the current bar and the indicator data6 will be displayed
But I don't know if I'm doing it right or not.
The problem is that OnChartEvent() does not work in the visual mode of the tester in Expert Advisors, in indicators only events of mouse click on the chart work. In the test indicators you are talking about, the panel displays data under the mouse cursor. That is, the programme tracks the cursor location and sends data to the panel from the bar that is under the cursor. In the visual mode of the tester, you need to click on the bar from which you want to get data on the panel. Or get data in OnTick(), but only from the current bar, as you did.
The problem is that OnChartEvent() does not work in the visual mode of the tester in Expert Advisors, only mouse click events on the chart work in indicators. In the test indicators you are talking about, the panel displays data under the mouse cursor. That is, the programme tracks the cursor location and sends data to the panel from the bar that is under the cursor. In the visual mode of the tester, you need to click on the bar from which you want to get data on the panel. Or get data in OnTick(), but only from the current bar, as you did.
All sorted out, re-read the first topic.
Basically, to output my information to the panel, I only need an event handler and call DrawData() In OnTick() and everything works.
Thanks, I've been looking for the simplest panel to output debugging information into it for a long time, because for some reason the speed of testing on visualisation drops many times through Comment(), the speed through the panel is as if it were a test without it.
All sorted, re-read the first thread.
In fact, to display my information in the panel, I only need an event handler and call DrawData() In OnTick() and everything works.
Thanks, I've been looking for the simplest panel to output debugging information into it for a long time, because for some reason the speed of testing on visualisation drops many times through Comment(), the speed through the panel is as if it were a test without it.
Good. I'm glad you have figured it out yourself
I apologise, maybe off-topic, I have been following your topics for a long time, you wrote that when the time comes, you will create an example robot on your library that on its basis it would be clear what and where to insert, to fully use and collect algorithms.
The time has not come yet? I just see the topics on the library are over.
I apologise, maybe off topic, I have been following your threads for a long time, you wrote that when the time comes, you will create an example robot on your library that on its basis it would be clear what and where to insert, to fully use and collect algorithms.
The time has not come yet? I just see the topics on the library are over.
On the library - on the continuation with graphics, while suspended development because of an unpleasant bug that manifests itself in periodic blinking of hidden parts of objects. Until I find the cause, I should not make graphics, so as not to accumulate bugs. But the rest of the library's features will be continued soon. And then we will get to examples.
- Free trading apps
- Over 8,000 signals for copying
- Economic news for exploring financial markets
You agree to website policy and terms of use
Check out the new article: DRAW_ARROW drawing type in multi-symbol multi-period indicators.
In this article, we will look at drawing arrow multi-symbol multi-period indicators. We will also improve the class methods for correct display of arrows showing data from arrow indicators calculated on a symbol/period that does not correspond to the symbol/period of the current chart.
We continue the topic of multi-symbol multi-period indicators. The previous article of the series covered the topic of multi-symbol multi-period indicators. In the current article, we will modify the multi-indicator class so that it can work with arrow indicators.
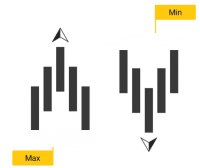
Arrow indicators imply that data is not constantly available in their drawing buffer. The value is present in the buffer where the arrow is displayed, while at other times the buffer contains the empty value set for it. Usually this is EMPTY_VALUE, but it is possible to set the buffer to any value that will be "empty" and will not be displayed on the chart. This can be done using the function
where buffer_index is a buffer index set to empty, while empty_value is the "empty value" that will be set for that buffer.
In multi-period indicators, where the buffer is filled with data with gaps, you need to take into account the presence of empty values where there are no arrows, and not enter these empty values into a chart bar where a non-empty value is already entered. Otherwise, the arrow placed earlier will be erased by a new empty value. This is true if data from an indicator calculated on a lower timeframe is copied to a higher timeframe.
Let me give an example. М15 bars are superimposed on M5 chart:
Here we see the fractals of the M5 chart, which need to be installed on the bars of the M15 chart.
Author: Artyom Trishkin