ranxero:
I'm trying to create an indicator for MT4 that displays a chart inside another chart.
Similar as in tradingview where you can open multiple charts to compare.
- Good luck with that, as I don't think it's possible with MT4.
- Why don't you just do that with the terminal?
- Good luck with that, as I don't think it's possible with MT4.
- Why don't you just do that with the terminal?
hi William,
thank you for your reply.
I guess you mean to open the chart to compare the standard way and resize it and put it on top of the main chart...
Sure, at first I did that but you can't have one chart full screen and another resized and that leads to a lot of re-adjusting/resizing.
In my case I have about 20 (main)charts open so a more elegant solution would be to integrate the chart to compare into the template.
Might as well be in a subwindow.
ok, I'm giving up.
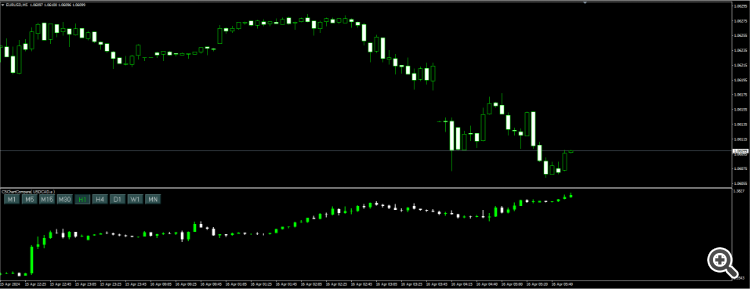
I wrote an indicator that works similar as on tradingview. It plots any chart into a subwindow and timeframes can be selected via buttons.
this is the code for the indicator. The class ObjectUtils only wraps ObjectCreate Methods ... nothing speical in there.
#property strict

#property indicator_separate_window
#property indicator_buffers 8


#property indicator_type1   DRAW_HISTOGRAM
#property indicator_style1  STYLE_SOLID
double topWickLong[];

#property indicator_type2   DRAW_HISTOGRAM
#property indicator_style2  STYLE_SOLID
double topWickShort[];


#property indicator_type3   DRAW_HISTOGRAM
#property indicator_style3  STYLE_SOLID
double bodyLong[];

#property indicator_type4   DRAW_HISTOGRAM
#property indicator_style4  STYLE_SOLID
double bodyShort[];


#property indicator_type5   DRAW_HISTOGRAM
#property indicator_style5  STYLE_SOLID
double bodyHideBelow[];


#property indicator_type6   DRAW_HISTOGRAM
#property indicator_style6  STYLE_SOLID
double botWickLong[];

#property indicator_type7   DRAW_HISTOGRAM
#property indicator_style7  STYLE_SOLID
double botWickShort[];


#property indicator_type8   DRAW_HISTOGRAM
#property indicator_style8  STYLE_SOLID
double botWickHideBelow[];

input string               Symbol="USDCAD.a";
extern ENUM_TIMEFRAMES     TimeFrame=PERIOD_H1;
input string               TimeFramesList="M1,M5,M15,M30,H1,H4,D1,W1,MN";
input color                BullCandleColor=Lime;
input color                BearCandleColor=White;
input int                  CandleBodyWidth=4;
input int                  WickWidth=1;
input int                  BtnStartX=10;
input int                  BtnStartY=15;
input int                  BtnWidth=40;
input int                  BtnHeight=25;
input int                  BtnGap=5;
input color                BtnBGColor=DarkSlateGray;
input color                BtnFgColor=White;
input color                BtnActiveColor=Lime;


string btnPrefix = "cschart_compare_btn_";
bool uiDone = false;

#include "..\\..\\Libraries\\rel\\ObjectUtils.mqh"

string indicatorName = StringFormat("CSChartCompare( %s )", Symbol);

//+------------------------------------------------------------------+
//| Custom indicator initialization function                         |
//+------------------------------------------------------------------+
int OnInit(){
   color bg    = (color) ChartGetInteger(0, CHART_COLOR_BACKGROUND);

   SetIndexBuffer(0, topWickLong);
   SetIndexLabel(0, NULL);
   SetIndexStyle(0, indicator_type1, indicator_style1, WickWidth, BullCandleColor);

   SetIndexBuffer(1, topWickShort);
   SetIndexLabel(1, NULL);
   SetIndexStyle(1, indicator_type2, indicator_style2, WickWidth, BearCandleColor);

   SetIndexBuffer(2, bodyLong);
   SetIndexLabel(2, NULL);
   SetIndexStyle(2, indicator_type3, indicator_style3, CandleBodyWidth, BullCandleColor);

   SetIndexBuffer(3, bodyShort);
   SetIndexLabel(3, NULL);
   SetIndexStyle(3, indicator_type4, indicator_style4, CandleBodyWidth, BearCandleColor);

   SetIndexBuffer(4, bodyHideBelow);
   SetIndexLabel(4, NULL);
   SetIndexStyle(4, indicator_type5, indicator_style5, CandleBodyWidth, bg);

   SetIndexBuffer(5, botWickLong);
   SetIndexLabel(5, NULL);
   SetIndexStyle(5, indicator_type6, indicator_style6, WickWidth, BullCandleColor);

   SetIndexBuffer(6, botWickShort);
   SetIndexLabel(6, NULL);
   SetIndexStyle(6, indicator_type7, indicator_style7, WickWidth, BearCandleColor);

   SetIndexBuffer(7, botWickHideBelow);
   SetIndexLabel(7, NULL);
   SetIndexStyle(7, indicator_type8, indicator_style8, CandleBodyWidth, bg);

   IndicatorShortName(indicatorName);

   objectUtils = new ObjectUtils();

   uiDone = false;
//---
   return   INIT_SUCCEEDED;
}

void OnDeinit(const int reason) {
  DeleteAll();
  delete objectUtils;
  Comment("");
}

void DeleteAll() {
  int total = ObjectsTotal(0, 0, -1);
  for (int i=total; i>=0; i--) {
    string name = ObjectName(i);
    if (StringFind(name, btnPrefix)>-1) {
      ObjectDelete(0, name);
    }
  }
}

void OnChartEvent(const int id,         // Event identifier
                  const long& lparam,   // Event parameter of long type
                  const double& dparam, // Event parameter of double type
                  const string& sparam) // Event parameter of string type
                  {
  if(id==CHARTEVENT_OBJECT_CLICK && StringFind(sparam, btnPrefix)>=0) {
   string btnText = ObjectGetString(0, sparam, OBJPROP_TEXT);
   TimeFrame = (ENUM_TIMEFRAMES)GetTimeFramePeriodFromString(btnText);
   uiDone = false;
   Plot();
  }
}

void SetupUI() {
   if (!uiDone) {
      DeleteAll();
      string tfs[];
      StringSplit(TimeFramesList, ',', tfs);

      int winIndex = WindowFind(indicatorName);
      if( winIndex == -1 ) {
         winIndex = 1;
      }
      int start = BtnStartX;
      for (int i=0; i<ArraySize(tfs); i++) {
         objectUtils.ButtonCreate(
                        btnPrefix + tfs[i],
                        tfs[i],
                        start + (i * (BtnGap + BtnWidth)),
                        BtnStartY,
                        BtnWidth,
                        BtnHeight,
                        (GetTimeFramePeriodFromString(tfs[i])==TimeFrame) ? BtnActiveColor : BtnFgColor,
                        BtnBGColor,
                        "Arial Bold",
                        12,
                        CORNER_LEFT_UPPER,
                        clrNONE,
                        false,
                        false,
                        false,
                        false,
                        0,
                        winIndex,
                        0
                     );
         ObjectSetString(0, btnPrefix + tfs[i], OBJPROP_TOOLTIP, "Switch timeframe to " + tfs[i]);
         ObjectSetInteger(0, btnPrefix + tfs[i], OBJPROP_STATE, (GetTimeFramePeriodFromString(tfs[i])==TimeFrame) ? 1 : 0);
      }
   }
   uiDone = true;
}

//+------------------------------------------------------------------+
//| Custom indicator iteration function                              |
//+------------------------------------------------------------------+
int OnCalculate(const int rates_total,
                const int prev_calculated,
                const datetime &time[],
                const double &open[],
                const double &high[],
                const double &low[],
                const double &close[],
                const long &tick_volume[],
                const long &volume[],
                const int &spread[]){
   Plot();
   return(rates_total);
}

void Plot() {
   SetupUI();
   MqlRates rates[];
   ArraySetAsSeries(rates, true);
   int numBars = WindowBarsPerChart();
   int copied = CopyRates(Symbol, TimeFrame, 0, numBars, rates);
   while (copied<=0 && numBars>0) {
      numBars--;
      if (numBars<=0) {
         return;
      }
      copied = CopyRates(Symbol, TimeFrame, 0, numBars, rates);
   }

   for(int i=0; i<ArraySize(rates); i++) {
      bool bull = (rates[i].open <= rates[i].close) ? true : false;

      topWickLong[i] = (bull) ? rates[i].high : EMPTY_VALUE;
      topWickShort[i] = (bull) ? EMPTY_VALUE : rates[i].high;

      bodyLong[i] =  (bull) ? MathMax(rates[i].open, rates[i].close) : EMPTY_VALUE;
      bodyShort[i] =  (bull) ? EMPTY_VALUE : MathMax(rates[i].open, rates[i].close);

      bodyHideBelow[i] = MathMin(rates[i].open, rates[i].close);

      botWickLong[i] = (bull) ? MathMin(rates[i].open, rates[i].close) : EMPTY_VALUE;
      botWickShort[i] = (bull) ? EMPTY_VALUE : MathMin(rates[i].open, rates[i].close);

      botWickHideBelow[i] = rates[i].low;

   }
}

string GetTimeFrame(int lPeriod) {
  switch(lPeriod) {
    case PERIOD_M1:  return("M1");
    case PERIOD_M5:  return("M5");
    case PERIOD_M15:  return("M15");
    case PERIOD_M30: return("M30");
    case PERIOD_H1:  return("H1");
    case PERIOD_H4:  return("H4");
    case PERIOD_D1:  return("D1");
    case PERIOD_W1:  return("W1");
    case PERIOD_MN1: return("MN1");
  }
  return IntegerToString(lPeriod);
}

int GetTimeFramePeriodFromString(string sPeriod) {
   if (sPeriod=="M1")  return PERIOD_M1;
   if (sPeriod=="M5")  return PERIOD_M5;
   if (sPeriod=="M15")  return PERIOD_M15;
   if (sPeriod=="M30") return PERIOD_M30;
   if (sPeriod=="H1")  return PERIOD_H1;
   if (sPeriod=="H4")  return PERIOD_H4;
   if (sPeriod=="D1")  return PERIOD_D1;
   if (sPeriod=="W1")  return PERIOD_W1;
   if (sPeriod=="MN") return PERIOD_MN1;
   return PERIOD_CURRENT;
}
- Free trading apps
- Over 8,000 signals for copying
- Economic news for exploring financial markets
You agree to website policy and terms of use

hi everyone,
I'm trying to create an indicator for MT4 that displays a chart inside another chart.
Goal is to directly compare two different instruments within the same (full size)window.
For example main chart is EURUSD and the one to compare is USDCAD.
Similar as in tradingview where you can open multiple charts to compare.
I already tried a lot but without the desired result. Main tasks are:
- open/close the chart via button inside the main chart
- resize and position the chart
I added an image to get a better idea.
Any approach with some pieces/fragments of sample code would be highly appreciated.
Thanks in advance