datetime plot_time = iTime(_Symbol, PERIOD_CURRENT, 0)+3*PeriodSeconds();You can treat time like integer.
Hi
As was written above - you can set time (as detetime value) as integer - so you can set time as TimeCurrent()+X*PeriodSeconds() – this way you get the candle time in the future. Here you need to rememeber about time gaps (like weekends etc) – but for the nearest future it will work perfectly.
As for the indicator buffers it’s a bit different – since there you set the “index” of the candle on which value is set. So you cannot really use time values. But you can set the shift in the initialization function for each buffer (SetIndexShift ) – so when you set 10 candles shift – then the index “0” would be the 10th candle in the future, and index “10” would be current candle.
In mt5 there is also PlotIndexSetInteger(buffer,PLOT_SHIFT,_shift) – so you can set values normally but the results are displayed shifted in the future.
Best Regards
Please consider which section is most appropriate — https://www.mql5.com/en/forum/172166/page6#comment_49114893

- www.mql5.com
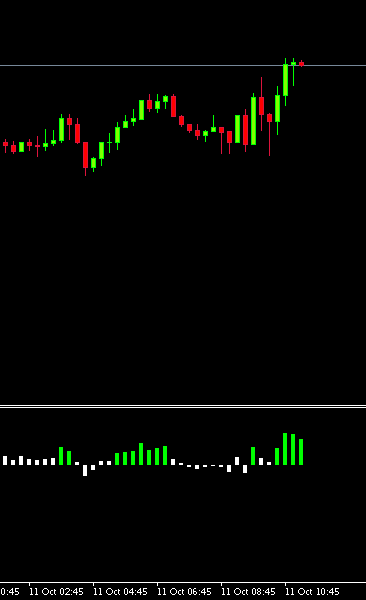
How can this be done for indicators? Like the screen shot below, I want to plot indicator values in the future. For now I'd like to add 3 additional bars all with a constant value.
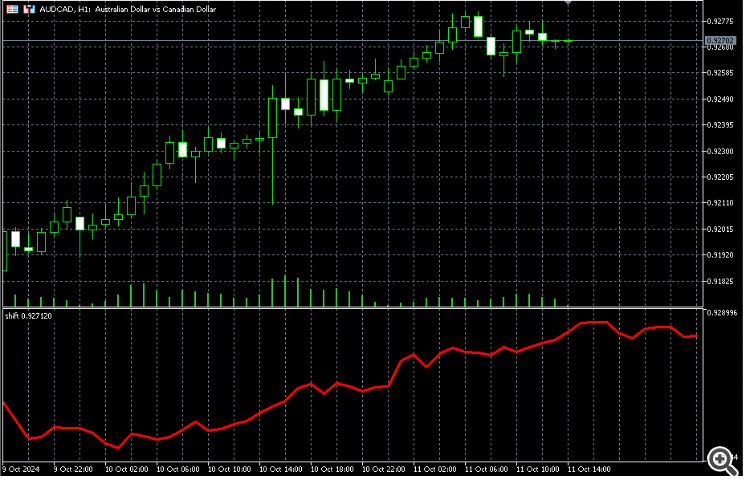
you can shift in mt5 too
#property indicator_separate_window
#property indicator_buffers 1
#property indicator_plots   1
//--- plot shifter
#property indicator_label1  "shifter"
#property indicator_type1   DRAW_LINE
#property indicator_color1  clrRed
#property indicator_style1  STYLE_SOLID
#property indicator_width1  1
//--- indicator buffers
double         shifterBuffer[];

int OnInit()
  {
   SetIndexBuffer(0,shifterBuffer,INDICATOR_DATA);
   PlotIndexSetInteger(0,PLOT_SHIFT,10);
   return(INIT_SUCCEEDED);
  }

int OnCalculate(const int rates_total,
                const int prev_calculated,
                const datetime &time[],
                const double &open[],
                const double &high[],
                const double &low[],
                const double &close[],
                const long &tick_volume[],
                const long &volume[],
                const int &spread[])
  {
//---
  for(int i=0;i<(rates_total-prev_calculated);i++){
     shifterBuffer[i]=high[i];
     }
//--- return value of prev_calculated for next call
   return(rates_total);
  }
- Free trading apps
- Over 8,000 signals for copying
- Economic news for exploring financial markets
You agree to website policy and terms of use


I've been working with ONNX models and I want to draw my model's forecast on to the chart so that as time goes on I can visually see the difference between what the model was expecting and what actually happened.
As trivial as that sounds, I'm having a headache trying to plot into the future. I've seen some forum posts on this issue already, however the discussions were not generalized enough, therefore after reading through the discussions I still wasn't able to resolve my issue.
I simply want to plot beyond the last candle.
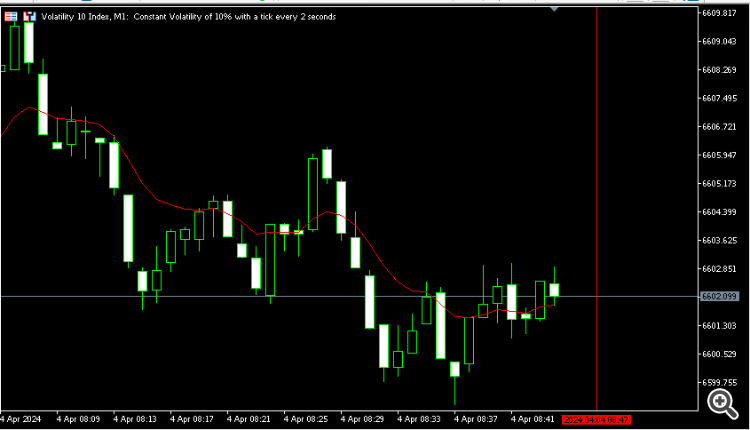
For example, let's imagine I want to plot a vertical line 3 steps into the future, I have been trying to write code for this but no avail. I know that the first parameter is the chart_id, then the name of the object, then the object type, then the sub-window the object should be displayed in, then comes date time 1 and lastly the price. The price is 0 because it's a vertical line. I know that date-time 0 represents this instance of time right now, and date-time 1 is the last fully formed candle prior to the time right now, I know how to plot backwards in time, but how do I go forward?
Needless to say, the negative indexing in the code example didn't work the way I thought it would.
Can we use this time to share definitively everything anyone would need to know regarding plots in the future? Also, I have chosen a simple Object like the "VLINE" because I want our discussion to be generalized and the rules we share will hopefully apply to all objects, that way other readers in future can still benefit from this discussion.
Lastly, this may be naive, but I hope that the rules that apply to plotting objects in the future also apply to plotting indicator buffers into the future. If not, then can anyone knowledgeable please help us understand both.