Drawing bugs on chart
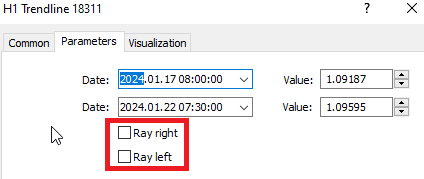
Have you ticked the ray on the second tab of the properties?
If you draw on GBP/CHF and the switch to EUR/USD, then obviously they will apear random.
The objects were originally based on GBP/CHF quote prices, and when you switch to EUR/USD those prices are totally off somewhere else on the chart.
How it's supposed to work. You draw anything on chart and those drawings are supposed to stay on that chart only.
So when I draw a trend line (and it happens to trend lines only) on GBP/CHF (for example) chart I can see those lines on EUR/USD. And they are shown in a random place.
This can be seen on screenshot.
you may have a template with selected indicators and did saving that template on GBPCHF when there were many trend lines from that chart.
now whenever you open a new chart default template opens all indicators plus those trendlines.
- Free trading apps
- Over 8,000 signals for copying
- Economic news for exploring financial markets
You agree to website policy and terms of use
How it's supposed to work. You draw anything on chart and those drawings are supposed to stay on that chart only.
So when I draw a trend line (and it happens to trend lines only) on GBP/CHF (for example) chart I can see those lines on EUR/USD. And they are shown in a random place.
This can be seen on screenshot.