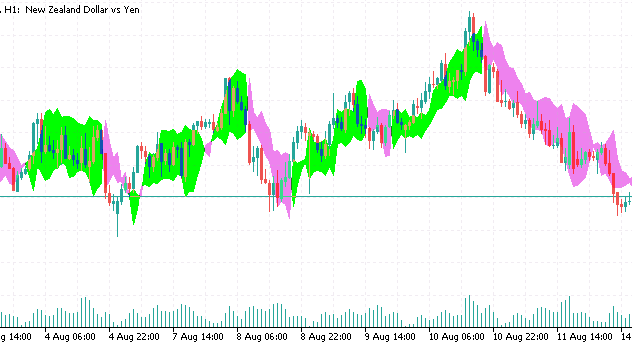
Until you can state your requirements in concrete terms, it can not be coded. Define “extreme peak.”
'extreme peak' for me is the last price action of a trend, and the first step of the next trend (opposite).
if the trend is bearish and the average percentage of that level is less than, for instance 10% as default(first tool), and the peak is high above 25% (second tool).
likewise, if the trend is bullish and the average percentage of that level is more than, for instance 90% as default(first tool), and the peak is high above 25%(second tool).
Please be specific about "tools". Indicators/API functions/mathematical theories?
If you're wondering about trend indicators, the parabolic SAR (stop and reverse), or the Supertrend are quite good for catching price reversal points
there is also the "chandelier exit" based on the ATR, you may say that the end of the green cloud or pink cloud is the alert to say you're at the extreme peak (and therefore it's the exit)

- Free trading apps
- Over 8,000 signals for copying
- Economic news for exploring financial markets
You agree to website policy and terms of use
What tools that give us signal and be alerted when price is at extreme peak (whether high or low)?
Some trader's say, "there's no such thing as overbought or oversold". Let me be clear that I'm not against the terminologies, or if you don't like the terms 'overbought' or 'oversold', that's fine. Whether you like it or not, they are all the same with the 'extreme peak'.