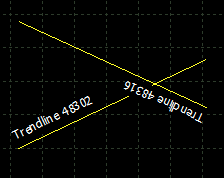
Trend line description
I don't think it's possible to change it. It seems to always be associated with the first anchor point and it's orientation.
I don't think it's possible to change it. It seems to always be associated with the first anchor point and it's orientation.
Do you know any other way to deal with it, when I create object and set string or text is no metter as I can't change location of that text in this object. Maybe shell I create text object, get x and y of that trendline and then anchor text whenever I like near the line ??
Yes, I supposed that is an option, but it will be quite CPU intensive, because, every time the chart shifts position or changes scale, you would need to update the X,Y coordinates of all those objects.
Yes, I supposed that is an option, but it will be quite CPU intensive, because, every time the chart shifts position or changes scale, you would need to update the X,Y coordinates of all those objects.
Work it out, not sure if that is the right way, but works. I used TextCreate() method, anchor point is time and price, one of the parameter is anchor type.
bool TextCreate(const long              chart_ID=0,               // chart's ID
                const string            name="Text",              // object name
                const int               sub_window=0,             // subwindow index
                datetime                time=0,                   // anchor point time
                double                  price=0,                  // anchor point price
                const string            text="Text",              // the text itself
                const string            font="Arial",             // font
                const int               font_size=10,             // font size
                const color             clr=clrRed,               // color
                const double            angle=0.0,                // text slope
                const ENUM_ANCHOR_POINT anchor=ANCHOR_LEFT_UPPER, // anchor type
                const bool              back=false,               // in the background
                const bool              selection=false,          // highlight to move
                const bool              hidden=true,              // hidden in the object list
                const long              z_order=0)                // priority for mouse click
  {

//--- reset the error value
   ResetLastError();
//--- create Text object
   if(!ObjectCreate(chart_ID,name,OBJ_TEXT,sub_window,time,price))
     {
      Print(__FUNCTION__,
            ": failed to create \"Text\" object! Error code = ",GetLastError());
      return(false);
     }
//--- set the text
   ObjectSetString(chart_ID,name,OBJPROP_TEXT,text);
//--- set text font
   ObjectSetString(chart_ID,name,OBJPROP_FONT,font);
//--- set font size
   ObjectSetInteger(chart_ID,name,OBJPROP_FONTSIZE,font_size);
//--- set the slope angle of the text
   ObjectSetDouble(chart_ID,name,OBJPROP_ANGLE,angle);
//--- set anchor type
   ObjectSetInteger(chart_ID,name,OBJPROP_ANCHOR,anchor);
//--- set color
   ObjectSetInteger(chart_ID,name,OBJPROP_COLOR,clr);
//--- display in the foreground (false) or background (true)
   ObjectSetInteger(chart_ID,name,OBJPROP_BACK,back);
//--- enable (true) or disable (false) the mode of moving the object by mouse
   ObjectSetInteger(chart_ID,name,OBJPROP_SELECTABLE,selection);
   ObjectSetInteger(chart_ID,name,OBJPROP_SELECTED,selection);
//--- hide (true) or display (false) graphical object name in the object list
   ObjectSetInteger(chart_ID,name,OBJPROP_HIDDEN,hidden);
//--- set the priority for receiving the event of a mouse click in the chart
   ObjectSetInteger(chart_ID,name,OBJPROP_ZORDER,z_order);
//--- successful execution
   return(true);
  }
- Free trading apps
- Over 8,000 signals for copying
- Economic news for exploring financial markets
You agree to website policy and terms of use
Hi Guys
Does any one know how to change location of Trend line description ?
Normally is anchor to the beginning of the line.
Can't find any thing in docs about it.
https://docs.mql4.com/constants/objectconstants/enum_object/obj_trend