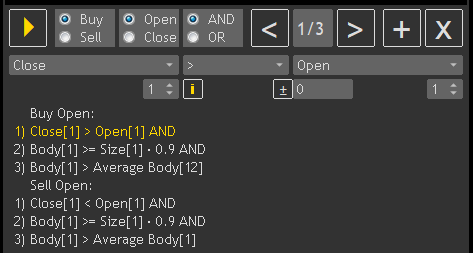
I am new trading. How do I install these? Thank you!
Mohamed,
Thank you for sharing your candlesticks pattern system. Is it possible to compile all candlesticks pattern into a single mql file? I am new to coding MT5. Can you guide me how to do it? Thanks again!
Tradermojocom #:
Mohamed,
Thank you for sharing your candlesticks pattern system. Is it possible to compile all candlesticks pattern into a single mql file? I am new to coding MT5. Can you guide me how to do it? Thanks again!
Thanks for your comment. Yes, you can do that.
Very helpful
Thanks for the insight, Very good post.
I was wondering regarding detecting Engulfing candlesticks, you have used the condition
So my question is, do you think the pattern became invalid when the close and open prices of Bar 2 and Bar 1 is not the same.
I was wondering regarding detecting Engulfing candlesticks, you have used the condition
if(close>open2&&open<close2)for Bullish Engulfing and condition if(close<open2&&open>close2)for Bearish engulfing. There condition that is true only when there is a gap. I mean how often does the gap occur? I was expecting use code it like thisif(close>open2&&open<=close2)for Bullish Engulfing and conditionif(close<open2&&open>=close2)for Bearish Engulfing. Because under the normal conditions the Open price of Bar 1 and Close price of Bar 2 is exactly the same. You code will detect the Engulfing pattern only when there is a market price gap. So my question is, do you think the pattern became invalid when the close and open prices of Bar 2 and Bar 1 is not the same.
Good Article. Its very helpful for understand how to create object pattern in mql5.
Good stuff. thanks a lot .
What is the condition for both bullish and bearish Marubozu
You are missing trading opportunities:
- Free trading apps
- Over 8,000 signals for copying
- Economic news for exploring financial markets
Registration
Log in
You agree to website policy and terms of use
If you do not have an account, please register

New article How to use MQL5 to detect candlesticks patterns has been published:
It is a bullish candlestick and consists of two candles also as the first candle is bearish and followed by a bullish one with lower open than the bearish one then moves up and closes above the midpoint of the first bearish candle. The following figure is for a graph that describes it:
It indicates that the buyer becomes stronger and controls the market after the control from the seller. So, it refers to a shift from selling to buying power as the buyer was able to push the price above the midpoint of the previous bearish candle although there was a gap when opening.
Author: Mohamed Abdelmaaboud